What Is a Hammer Candlestick Pattern? How to Spot, Identify & Use the Pattern

Most people lose money on the hammer candlestick pattern. And this isn’t because the pattern fails. It’s typical trading psychology risks - people don’t wait long enough to see what comes next and buy the candlestick immediately.
That one thing is the difference between a trader and the person who gets into trading after reading a blog. So I’ll try to keep things simple here. We’ll explain what a hammer candlestick pattern actually is, how to identify it on a chart, what the green hammer and red hammer candlesticks are, how reliable it really is, and how to trade it on something like BTC or ETH.
Key Takeaways
- A hammer candlestick pattern is a single-candle bullish reversal signal that forms after a downtrend.
- Both the green hammer candlestick and the red hammer candlestick are bullish at the bottom. Green is slightly stronger.
- Reliability is moderate, not guaranteed. Around 60% in historical studies, and only with context.
What a Hammer Candlestick Pattern Actually Is?
A hammer candlestick pattern is a single candle with a small real body near the top of its range and a long lower shadow, signaling that sellers pushed the price down hard but the buyers took it back before the close. It looks like the letter T, and it only counts as a hammer when it shows up after a downtrend.
The three defining traits:
- A small body at the upper end of the candle.
- A long lower shadow, at least twice the length of the body.
- And little to no upper shadow.
The body color can be green or red, and both are valid. But what makes it a bullish hammer candlestick is the rejection of lower prices, not the color.
The Price Action Behind a Hammer Candlestick Formation
A hammer candlestick formation is a short story about a failed sell-off. Sellers open in control and try to drag the price lower, but then the buyers step in with enough force to close the candle back near where it opened.
That long lower wick is proof that the price hit the lower levels and got rejected. On a live Bitcoin chart, you often see this after a sharp intraday dump, where price briefly cracks a level, gets hit with panic selling, and the buyers absorb all of it inside the same candle.
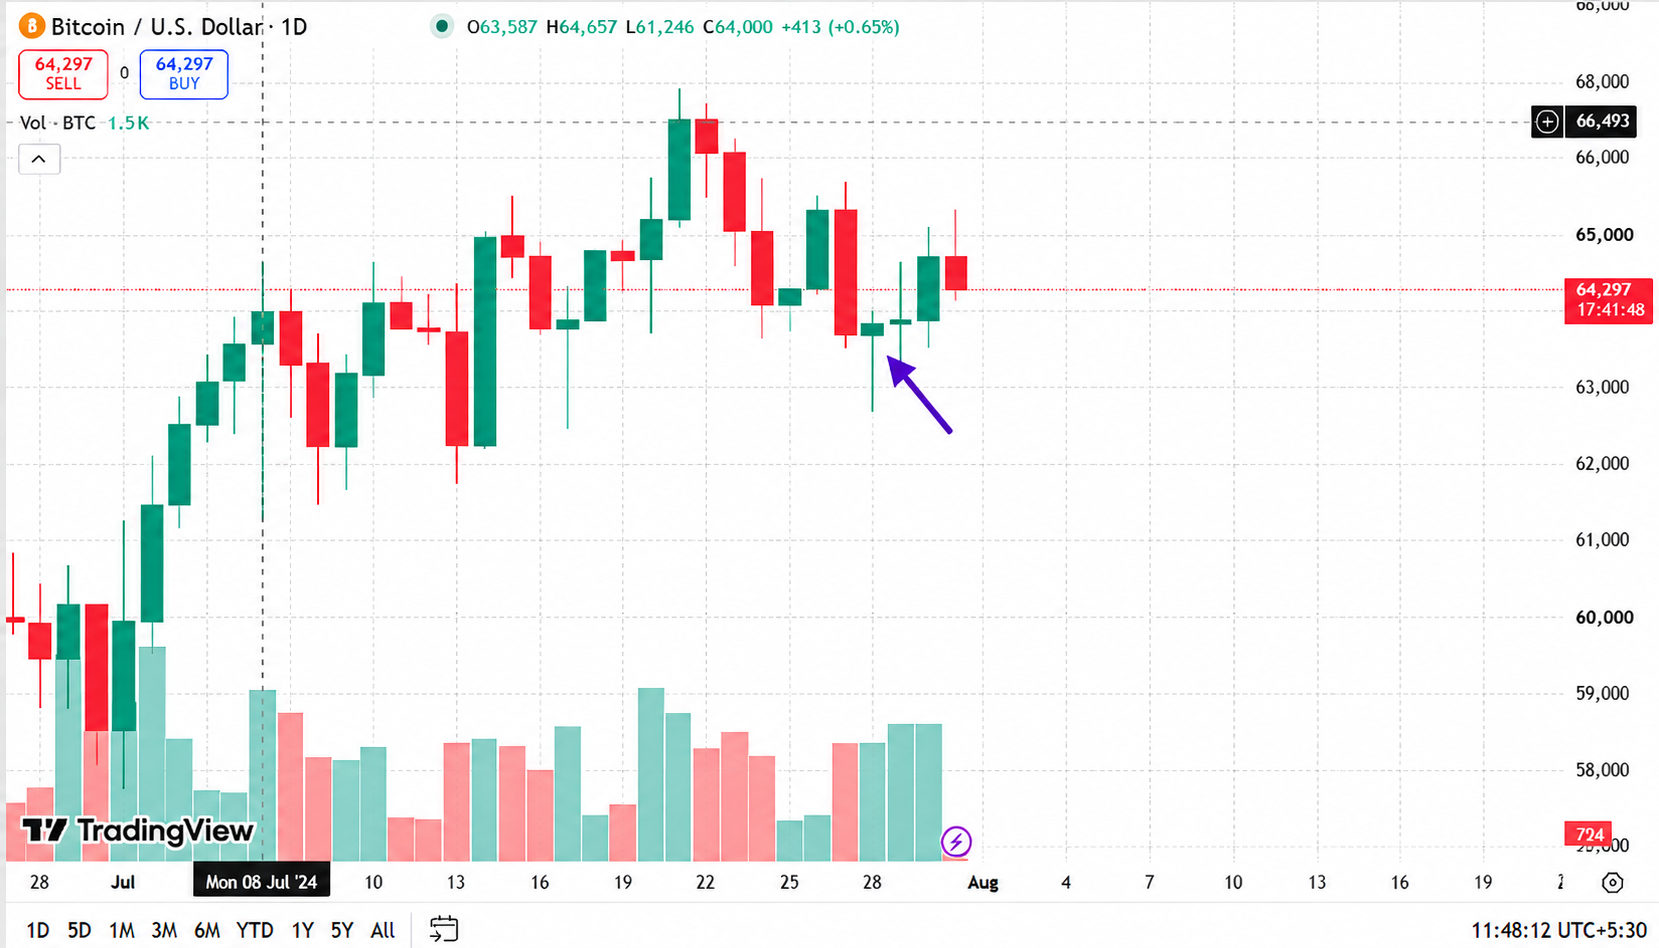
This is how the shift in control happens:
- Sellers dominate the first half of the candle.
- Buyers overwhelm them by the close.
- The wick shows where the market said no.
The bigger the wick is relative to the body, the louder that buyer push is.
How to Identify a Hammer Candlestick on a Chart
To identify a hammer candlestick, always run a quick 4-point checklist. This will help you avoid misreading a random candle as a reversal hammer candlestick.
- Prior downtrend: The candle must follow a visible move down.
- Shadow-to-body ratio: The lower shadow should be at least 2x the body.
- Body position: The body sits near the top of the range.
- Upper shadow: Little to none.
Few things you must keep in mind. The location matters more than shape. A textbook hammer floating in the middle of a range means very little. The same candle on a support level carries actual weight.
Green Hammer vs. Red Hammer Candlestick: Which Is Stronger
Both are bullish at the bottom of a downtrend.
Green hammer candlestick
A green hammer candlestick closes above where it opened. Buyers didn’t just absorb the selling pressure; they pushed the price into positive territory by the EoD. This is the stronger of the two because it shows bulls fully overpowering bears in a single candle.
Red hammer candlestick
A red hammer candlestick closes slightly below its open, but it’s still bullish. Buyers reclaimed most of the lost ground but couldn’t quite close green. The idea that a red hammer is bearish is wrong. The long lower wick is the actual indicator.
Hammer vs. Other Reversal Candlestick Patterns
The hammer belongs to a family of reversal hammer candlestick patterns that get confused constantly, and the confusion costs people trades.
If you notice, a hammer and a hanging man are the exact same shape. The only difference is the price movement prior to that.
Also Read: Understanding Candlestick Charts
How to Trade a Hammer Candlestick
Here’s the sequence I follow:
- Spot the setup: Try to find a valid hammer at a support level after a clear downtrend, ideally with above-average volume on the hammer candle.
- Wait for confirmation: The next candle should close above the hammer's high.
- Enter above the high: Place your entry just above the hammer's high, once the confirmation candle validates the move.
- Set your stop-loss below the low: Put the stop-loss just under the hammer's lowest wick. If price breaks below that, the reversal theory is dead.
- Plan your exit: The hammer gives no price target, so use the next resistance level or a fixed risk-reward ratio to decide.
But for the crypto market, you must consider two things. The markets run 24/7, so a hammer can print at any time with no session close to lean on. And volatility is higher, which means wider stops and more fakeouts.
How Reliable Is the Hammer Candlestick Pattern
The hammer is moderately reliable. Candlestick research puts the hammer's bullish reversal success rate at roughly 60%.
Two factors that could work in your favor:
- Volume: A hammer on heavy volume means real buying pressure.
- Support: A hammer at a support level is the one you should trust, rather than one in the open space.
Cross-checking multiple trading sources is very important. Almost none treat the hammer as a standalone signal, and every credible one pairs it with confirmation and context.
Common Mistakes to Avoid With Hammer Candlestick Patterns
Most hammer losses come from a short list of repeat offenders:
- Trading the hammer in isolation, with no other level or indicator backing it.
- Ignoring the prior trend and calling any T-shaped candle a hammer.
- Skipping the confirmation candle and buying the wick.
- Having no exit plan, since the pattern gives no target.
- Buying every hammer on the chart.
The hammer candlestick pattern is a bad fit if you’re a long-term investor. It’s built for short-term and intraday decisions.
Should You Trade the Hammer Pattern?
The hammer candlestick pattern is a genuinely useful early warning that a downtrend may be running out of sellers. It works best as one input inside a broader read of trend, volume, and support. Learn to spot it on live BTC or ETH charts, wait for confirmation every time, and treat it as a decision-making factor.
Want to explore automated crypto derivatives trading? Visit the website at www.delta.exchange or join their community on X.
FAQs
- Is a hammer candlestick pattern bullish or bearish?
Answer: It’s bullish. A hammer forms after a downtrend and signals that price may have found a bottom and could reverse upward.
- Is a red hammer candlestick still bullish?
Answer: Yes. A red hammer candlestick is bullish because buyers absorbed the selling, even though the candle closed just below its open.
- What is the difference between a green and red hammer candlestick?
Answer: A green hammer closes above its open and is slightly stronger. A red hammer closes just below its open but stays bullish at a bottom.
- Where does a hammer candlestick pattern form?
Answer: At the bottom of a downtrend. The same shape after an uptrend is a hanging man, which is bearish.
- How reliable is the hammer candlestick pattern?
Answer: Moderately, around a 60% historical success rate, and only when paired with confirmation, volume, and a support level.