How to Use Spinning Top Candlestick Pattern to Trade Crypto

A spinning top candlestick pattern is a small-bodied candle with long upper and lower wicks of similar length, signaling indecision between buyers and sellers. It often appears at the end of an uptrend or downtrend and can signal a potential trend reversal, especially when confirmed by the next candle's price action.
Technical analysis is something most seasoned crypto traders rely on to figure out the best possible opportunities for trade in the future. Instruments of technical analysis- better known as technical indicators, take into account factors like market history, past trends, and trader sentiments to issue predictions on the future of the market for a particular crypto. A very common candlestick pattern widely trusted by crypto traders is the spinning top candlestick pattern, which usually works to point out a potential trend reversal. In this post, we discuss the spinning top candlestick pattern and its workings, and find out all the pros and cons of using the technical indicator.
What is the spinning top candle pattern?
A spinning top is a small candlestick pattern that signals indecision about a cryptocurrency's future price direction - neither buyers nor sellers have control. This indecision often precedes a price reversal, making the spinning top one of the more widely watched candlestick reversal patterns in crypto technical analysis.
Key Features:
- A short body vertically centered in between long upper and lower shadows, where the opening and closing prices are quite close to each other.
- Long wicks or shadows exist on both sides of the spinning top candle, and they are similar in length.
The spinning top candlestick pattern forms during both uptrends and downtrends, and it signifies a possible trend reversal. The small body of the spinning top candlestick pattern indicates indecision in a market regarding the future direction of the asset, as mentioned before. It means that neither the buyers or the sellers could have an upper hand. On some rare instances, the spinning top candlestick pattern can even form within the middle of a trend, and signal yet more consolidation. So, if the spinning top candlestick pattern develops at the very end of a bearish trend, it might be signaling the end of said bearish trend and the beginning of another uptrend. On the other hand, say if the spinning top candle pattern develops at the end of a bullish trend, it may signal the end of that streak and a turn in the other direction.
How to Trade Crypto Using the Spinning Top Candlestick Pattern?
When trading using the spinning top candlestick pattern, you have to remember that there are two distinct types of the spinning top candlestick pattern:
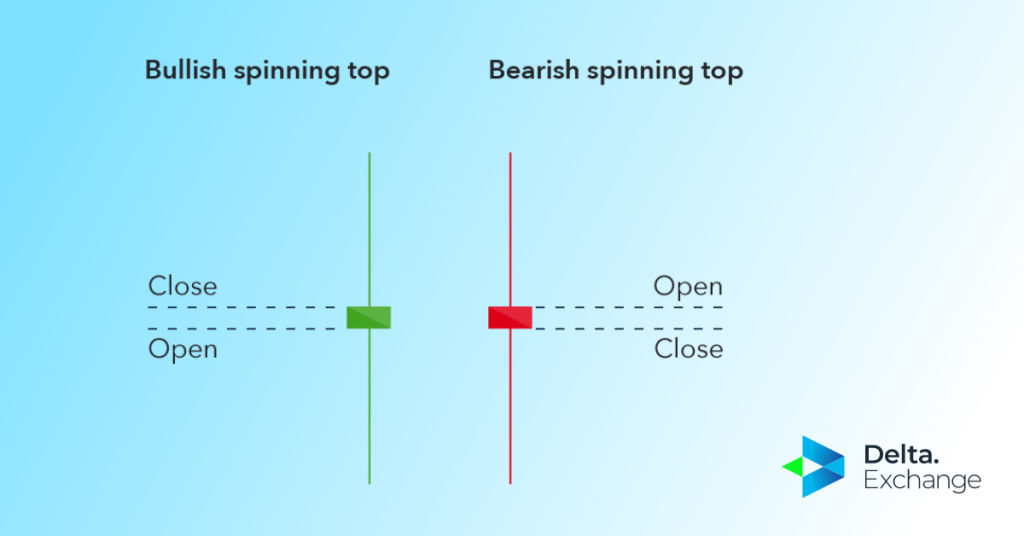
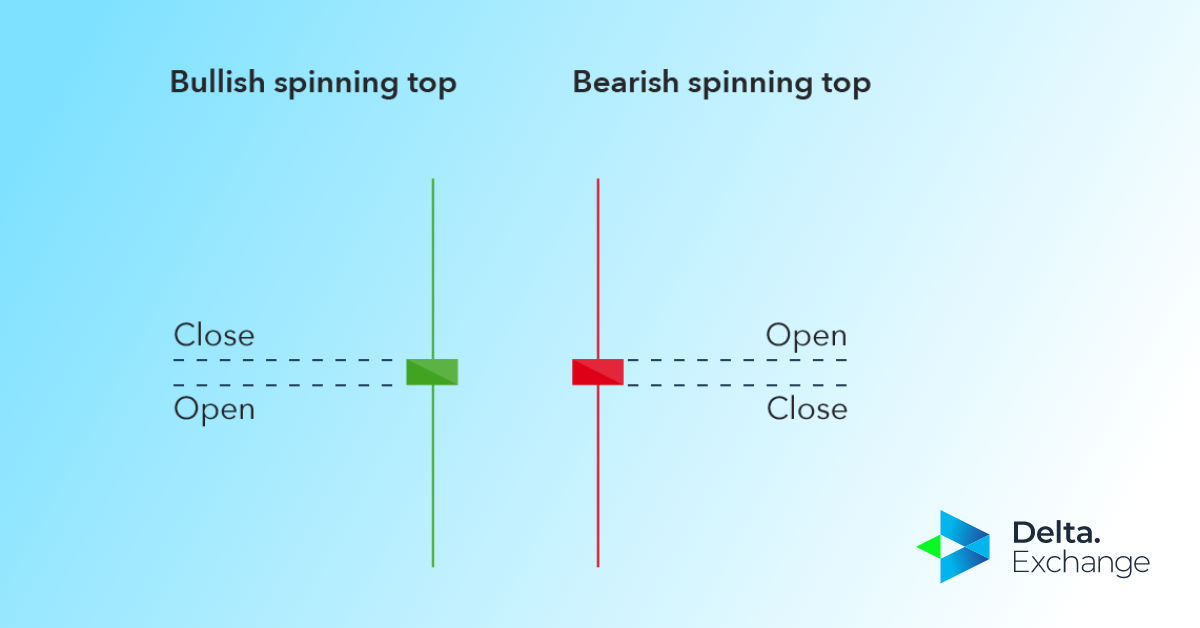
- The bullish spinning top candlestick pattern: This one forms when the closing price is over the opening price, resulting in a green candle.
- The bearish spinning top candle pattern: This one is developed when the closing price is below the opening price, thus resulting in a red candle.
We can see the differences between the bullish and bearish spinning top candlestick pattern in the image below:
When trading crypto with the help of the spinning top candlestick pattern, you must keep in mind that it’s always better to use the instrument combined with other tools for technical analysis and other trading strategies. This is because just relying on the spinning top candle pattern without having thorough knowledge of the prevailing trends can lead to ill-executed trades.
Pros of Using the Spinning Top Candlestick Pattern
Here are some of the many advantages of using the spinning top candle pattern in crypto trades:
- The spinning top candlestick pattern is especially useful in predicting any future price movements, since it essentially gives traders a hint of what’s happening behind the scenes with the battle between bullish and bearish sentiments.
- Using the spinning top candlestick pattern is pretty simple and straightforward.
- Determining the result from the chart is also really easy.
- When compared to other candlestick formations and technical indicators traders use, the spinning top candle pattern lets you get into a trade immediately after the pattern has developed on the price chart.
- The technical indicator goes really well with other tools for technical analysis like the Fibonacci support and resistance levels.
Limitations of the Spinning Top Candle Pattern
Just like any other technical indicator, the spinning top candlestick pattern does not always produce accurate forecasts on its own. Limitations of the technical indicator include:
- The implications of the spinning top candle pattern is not always clear, and can be subjected to individual interpretation.
- Used on its own, the spinning top candlestick pattern does not usually root out a concrete entry point.
Spinning Top Candlestick Example on a Bitcoin Chart
The spinning top candlestick patterns, as mentioned before, are pretty easy to determine on the price chart. An example of the spinning top candle pattern can be seen in the image below.
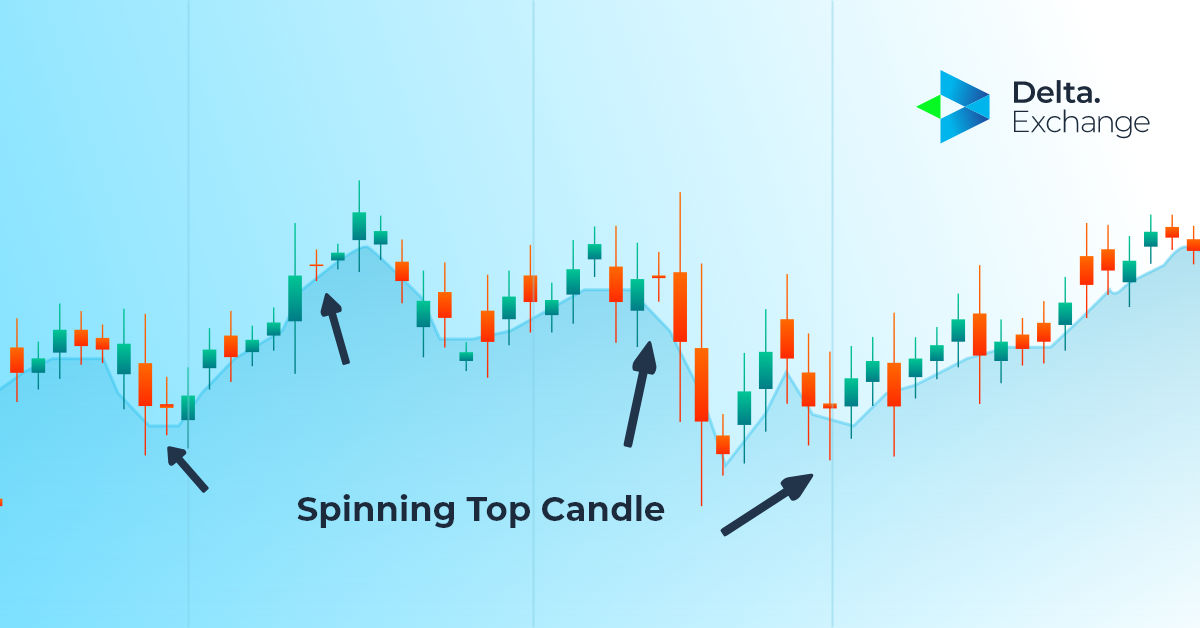
We can see three instances of the spinning top candle pattern on the left-hand side of the above 4-hour Bitcoin price chart. The price went up higher as a result, and in retrospect, a trader might have bought BTC-USD at those levels with a protective stop-loss right below the spinning top candle low. Additionally, since we have two consecutive spinning tops being developed one after another further adds confirmation to the bullish pattern. The second spinning top candlestick pattern is developed at the end of an uptrend, and is immediately followed by a big price reversal. The big downward candles that follow this particular spinning top candlestick work to confirm the upcoming reversal. The final example of the spinning top candlestick happens after the price has been going down. The bullish reversal signal takes place at a key support level, at a point previous candlesticks have bounced off of. This way, the final spinning top candlestick flags an upward trend.
Difference between Spinning Top vs. Doji Candlestick
Both patterns signal market indecision and often appear before a reversal, but they look different:
| Spinning Top | Doji | |
|---|---|---|
| Body | Wider real body | Very thin/cross-shaped body |
| Open vs. Close | Close, but a visible gap | Nearly identical |
| Wicks | Long, roughly equal | Long, roughly equal |
Both patterns rely on confirmation from the next candle, and both carry more weight when followed by a strong move opposite the prevailing trend.
Conclusion
No single technical indicator guarantees accurate outcomes on its own. The spinning top candlestick pattern, used alongside other technical indicators and confirmation signals, can help crypto traders spot potential trend reversals and time entries more effectively.
Frequently Asked Questions (FAQs)
1. What is the spinning top candlestick pattern?
Ans: A spinning top candle is a small candlestick pattern that can signal indecision regarding the future price direction of a certain cryptocurrency. The spinning top candlestick pattern forms during both uptrends and downtrends, and it signifies a possible trend reversal. The small body of the spinning top candlestick pattern indicates indecision in a market regarding the future direction of the asset, as mentioned before. It means that neither the buyers or the sellers could have an upper hand.
2. How many types of the spinning top candlestick pattern are there?
Ans: There are two different types of the spinning top candlestick pattern, which are:
- The bullish spinning top candlestick pattern: This one forms when the closing price is over the opening price, resulting in a green candle.
- The bearish spinning top candle pattern: This one is developed when the closing price is below the opening price, thus resulting in a red candle.
3. What are the differences between the spinning top candlestick pattern and the doji candle?
Ans: The spinning top candlestick pattern works to signal an indecision in the crypto market when neither the sellers or the buyers has an upper hand, and the doji candle is another candlestick pattern that also points out indecision in the market. Thus, both the spinning top candle pattern and the doji candlestick pattern signal a potential price reversal of the prevailing market trend, and on top of that, they look very similar to each other. However, there are quite a few key differences between the spinning top candlestick pattern and the doji candlestick pattern. Namely, visually the doji candle pattern is shaped like a cross; this is because it has a short body and smaller upper and lower shadows. Most of the time, the opening price is similar to the closing price. When compared closely, the spinning top candlestick pattern has a much wider candle body and longer wicks. The spinning top candle pattern and the doji candlestick pattern both occur pretty often across all time frames, and with all digital currencies. At the end of the day, both of these candlestick patterns rely on the confirmation received from the next candle. What’s more, if either the spinning top candlestick pattern or the doji candle pattern are followed by a strong move in the opposite direction of the currently prevailing market trend, we can safely assume there is an even greater chance of a trend reversal.