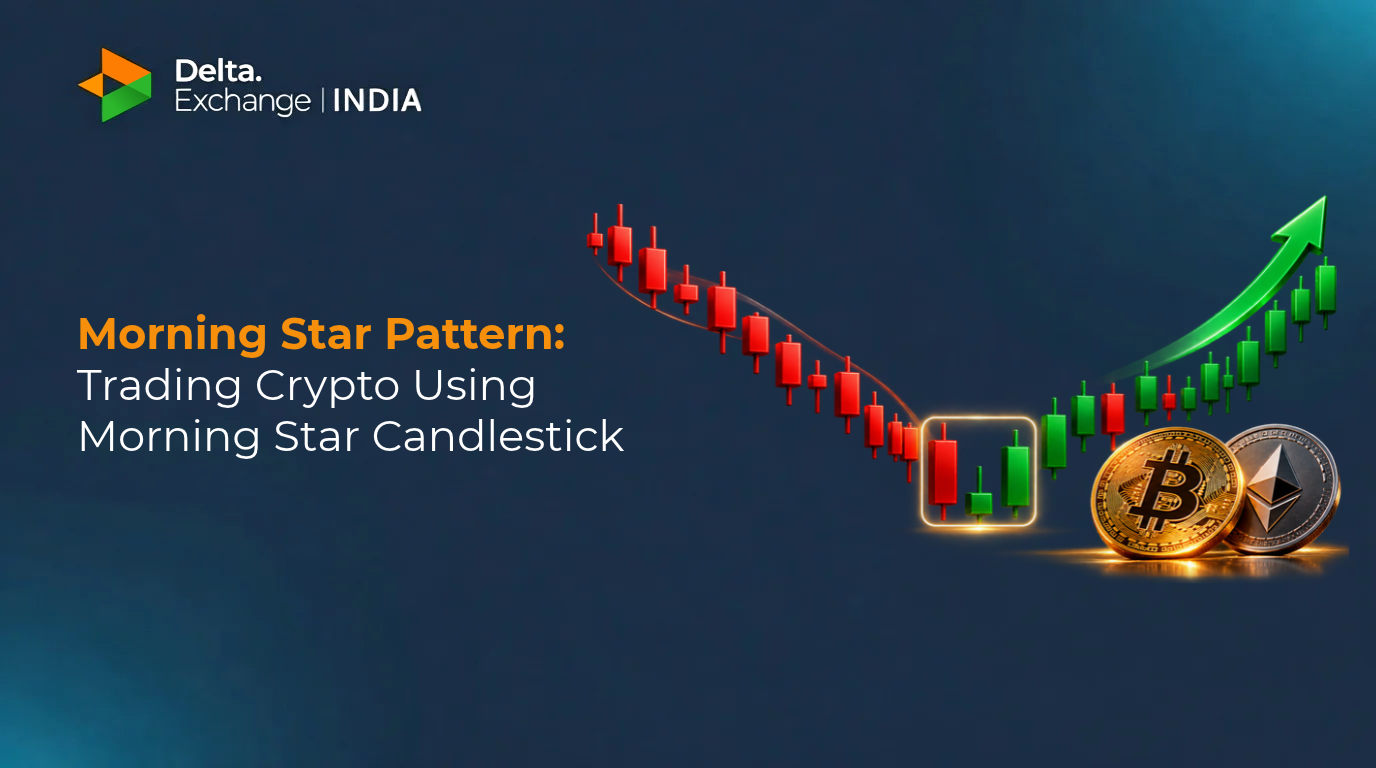
Morning Star Pattern: Trading Crypto Using Morning Star Candlestick

The morning star pattern is a three-candle bullish reversal signal that can form at the end of a downtrend: a long bearish candle, a small-bodied “star” candle that shows indecision, and a long bullish candle that closes above the midpoint of the first candle’s body. It suggests sellers are losing momentum, but it is not a guarantee of a reversal, so traders usually wait for confirmation from volume, a support level or an indicator such as RSI before acting on it.
When a market has been falling for days or weeks, traders look for early evidence that selling pressure is fading. The morning star candlestick pattern is one of the most widely taught of those signals. On a crypto chart it can mark the point where sellers lose control and buyers step in - a point some traders treat as a cue to start looking for long setups, never as a standalone buy signal.
This guide explains how to identify the pattern step by step, how it differs from the evening star and the bullish harami, how to plan a trade around it with a worked example, and where it tends to fail - whether you chart BTC, ETH or other markets on Delta Exchange or elsewhere.
Key Takeaways
- Three-candle bullish reversal pattern that forms after a downtrend.
- Structure: large bearish candle - small-bodied “star” candle - large bullish candle closing above candle 1's midpoint.
- Mirror opposite of the bearish evening star pattern.
- A true-doji middle candle (morning doji star) is generally viewed as a stronger version.
- Crypto trades 24/7, so the classic price gaps rarely appear; the close-above-midpoint rule matters more.
- Reported success rates vary by market, timeframe and test method, and no candlestick pattern works every time. Treat it as one input, not a prediction.
- Works best with confirmation from support levels, RSI or volume - not as a standalone signal.
- If price closes below the lowest low of the three candles, the setup has failed.
What Is the Morning Star Candlestick Pattern?
The morning star candlestick pattern is a three-candle bullish reversal formation that appears at the bottom of a downtrend. It takes its name from the astronomical "morning star" the planet Venus, which appears in the sky just before sunrise - much like this pattern tends to appear just before a market shifts from a downtrend toward an uptrend.
Key characteristics of the Morning Star Candlestick Pattern:
- Pattern type: Bullish reversal
- Number of candles: Three
- Typically appears after: An established downtrend
- Opposite formation: The candlestick evening star pattern (a bearish reversal)
- Best used alongside: Volume, RSI, and moving averages for confirmation
What Does Each Candle Tell You?
- Candle 1 (long bearish): sellers are firmly in control and the downtrend appears intact.
- Candle 2 (small-bodied star): momentum stalls. Buyers and sellers are roughly balanced, so price barely moves from open to close. The star’s colour matters less than its small body.
- Candle 3 (long bullish): buyers take over and reverse at least half of candle 1’s loss. This is the candle that separates a real shift from a mere pause.
Does the Morning Star Pattern Need a Gap Between Candles?
Classic technical analysis literature describes the morning star with a gap down into the second candle and a gap up into the third. In crypto, where markets trade 24/7 with no daily close, true price gaps are rare compared to stocks or futures that open and close on a schedule. Most crypto traders instead focus on the core structural rules - a large bearish candle, a small-bodied second candle, and a third candle that closes above the first candle's midpoint - and treat a literal gap as a bonus confirmation rather than a requirement
How Do You Identify a Morning Star Pattern in Crypto Charts?
You identify a morning star pattern by locating a downtrend, then checking the last three candles against the pattern's structure: a long bearish candle, a small second candle, and a long bullish candle closing above the first candle's midpoint.
1. The first step is to locate a downtrend in the market. The downtrend is identified by a series of lower lows and lower highs, as shown in the BTCUSD daily price chart below.
2. The next step is to look for the formation of the three candles that make up the Morning Star pattern.
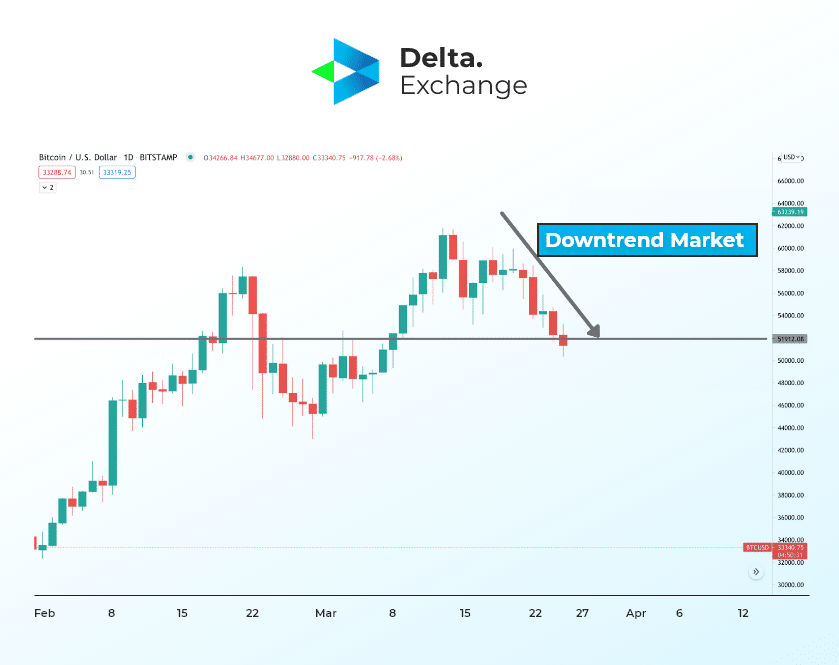
3. The first candle is a bearish candle, also known as the "long black candle". This candle should be relatively large and should have a relatively small or non-existent upper shadow.
4. The second candle is a small candle, also known as the "doji". This candle should have a small real body and long upper and lower shadows.
5. The third candle is a bullish candle, also known as the "long white candle". This candle should be relatively large and should have a relatively small or non-existent lower shadow. It's important to note that the second candle (doji) should be located within the range of the first candle. The third candle should close above the midpoint of the first candle.
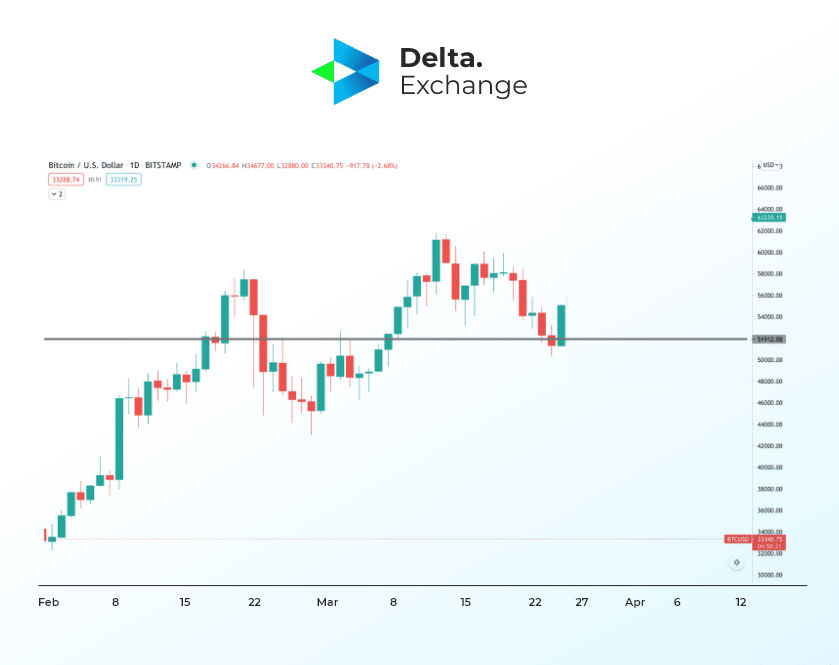
As a continuation to the chart above, now we see a bullish candle that closed over the high of the candle twice removed from it. Comparing the last three candle formations, this chart now satisfies the conditions for the morning star pattern.
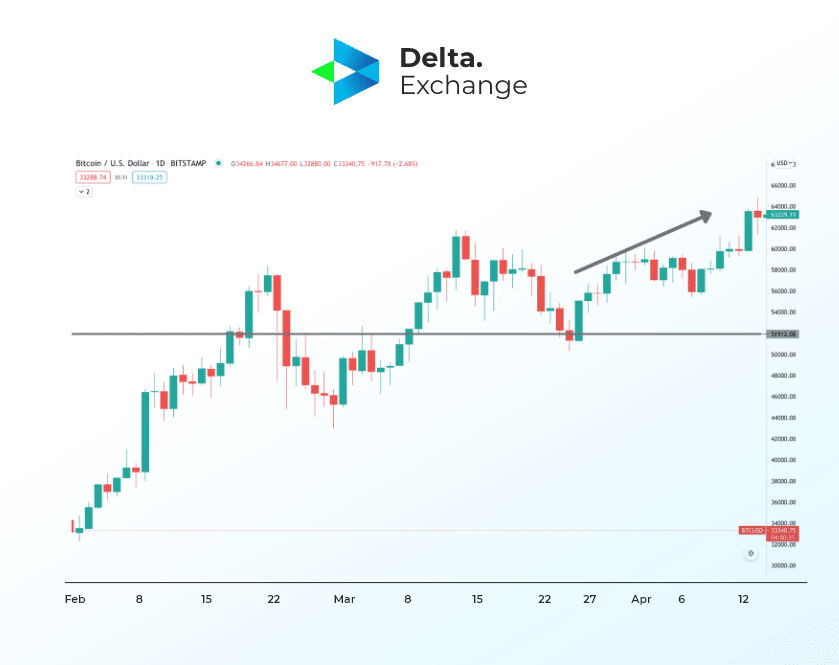
Finally, this image shows the pattern was indeed correctly identified, and it is a sign that the bears are losing control and that the bulls are gaining control. This can be a setup some traders watch for potential long entries, alongside other confirmation tools.
Morning Star Checklist
Morning Star vs Bullish Harami and Other Bullish Reversal Patterns
The morning star is a three-candle pattern, while a bullish harami uses only two candles: a small candle contained within the body of the prior large bearish candle, with no third confirming candle. Traders sometimes mistake an early morning star setup for a harami; the distinguishing factor is the presence and close of the third bullish candle above the first candle's midpoint, which the harami pattern does not require.
What's the Difference Between the Morning Star and Evening Star Pattern?
The morning star and evening star are mirror-image three-candle reversal patterns. The morning star is a bullish reversal that appears after a downtrend, while the evening star is a bearish reversal that appears after an uptrend. Both are three-candle formations built from a large candle, a small "star" candle, and a large candle in the opposite direction.
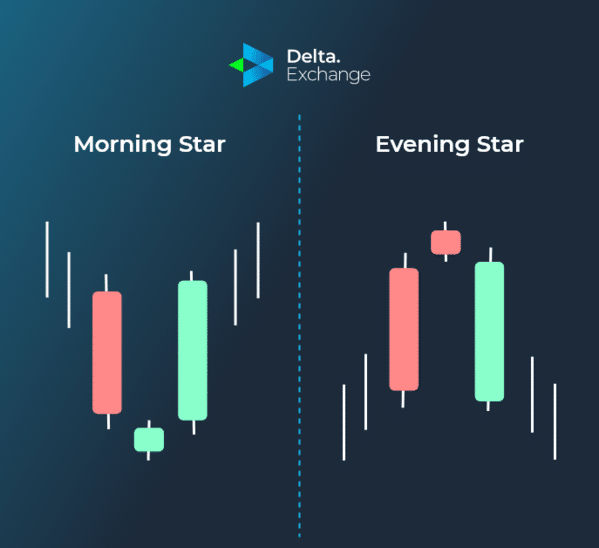
Traders who see an evening star after a rally may consider tightening stops, reducing long exposure or looking for short setups, subject to the same confirmation steps.
How Do You Trade Crypto Using the Morning Star Pattern?
Trading the morning star pattern typically involves confirming the setup with other indicators, defining an entry near the third candle's close, and pre-setting a stop-loss - it is not a standalone signal to be traded in isolation.
- Locate the pattern: Confirm a prior downtrend and check all three candles against the checklist above.
- Confirm the signal: Look for at least one independent confirmation: a support level, RSI turning up from oversold, higher volume on candle 3, or a bullish trend on a higher timeframe. More independent confirmations make a setup more reliable, but none guarantees a reversal.
- Choose your entry: An aggressive entry is the close of candle 3 - the earliest signal and the riskiest. A conservative entry waits for the next candle to trade above candle 3’s high.
- Place a stop-loss: Set it just below the lowest low of the three candles (usually the star’s low).
- Size the position before you enter: Decide what share of your account you are willing to lose if the stop is hit (many traders use 1–2%) and size the position from the distance between entry and stop. Leverage does not change that risk budget; it only makes a given price move use more of your margin.
- Plan profit targets: Common targets are the nearest resistance, the previous swing high, or a 38.2–61.8% Fibonacci retracement of the prior downswing. Many traders look for at least twice the risk before taking a setup.
- Know when the setup fails: If price closes below the stop level, the pattern has failed: exit rather than moving the stop lower. Otherwise, review the trade at each candle close on your chosen timeframe.
Just How Reliable is the Morning Star Pattern while Trading Crypto?
The Morning Star pattern is considered a relatively reliable reversal pattern in the stock and crypto markets, but it's not a guaranteed indicator of a reversal. The pattern is a signal that the bears have exhausted themselves and the bulls are ready to take control of the market. However, it's important to use the pattern in combination with other technical analysis tools and indicators to make a more informed decision.
Limitations of the Morning Star Pattern
The Morning Star pattern is a relatively reliable reversal pattern, but it does have some limitations. Here are a few things to keep in mind when using the pattern:
- False signals: The pattern can generate false signals, especially in choppy or sideways markets. It's important to use the pattern in combination with other technical analysis tools and indicators to confirm the validity of the pattern.
- Limited to downtrends: The pattern is only useful for identifying potential reversals in downtrends. It's not useful for identifying potential reversals in uptrends.
- Not a guaranteed indicator of a reversal: It's not a guaranteed indicator of a reversal and it's important to use the pattern in combination with other technical analysis tools and indicators to make a more informed decision.
Conclusion: Trading the Morning Star Pattern
The morning star candlestick pattern is a useful way to spot when a downtrend may be losing momentum, but it works best as one input among several: a clear prior downtrend, a support level, volume or RSI confirmation, a defined stop-loss and a position size you can afford to lose. Understanding the evening star alongside it gives you a view of potential reversals in both directions. Want to practise reading candlestick patterns on live charts? Explore crypto futures and options on Delta Exchange, an FIU-registered platform serving traders in India.
Disclaimer: This article is for educational purposes only and is not financial or investment advice; cryptocurrency derivatives trading carries substantial risk and is not suitable for everyone.
Frequently Asked Questions
Q. What is the morning star candlestick pattern?
A. The morning star candlestick pattern is a three-candle bullish reversal formation - a long bearish candle, a small-bodied "star" candle, and a long bullish candle - that typically appears at the end of a downtrend and signals that buyers may be regaining control.
Q. How do I confirm the validity of the Morning Star pattern?
A. To confirm the validity of the Morning Star pattern, use other technical indicators such as moving averages, Relative Strength Index (RSI), and volume. The more confirmations, the more reliable the pattern.
Q. What is the difference between a morning star and an evening star pattern?
A. The morning star pattern is a bullish reversal that appears after a downtrend, while the evening star pattern is a bearish reversal that appears after an uptrend. Both are three-candle formations, but their candle order and market implications are mirror opposites of each other.
Q. What is a morning doji star?
A. A morning doji star is a version of the morning star pattern where the middle candle is a true doji, meaning its open and close prices are nearly identical. It's generally viewed as a stronger bullish reversal signal than a standard morning star with a larger-bodied middle candle.
Q. Is the morning star pattern bullish or bearish?
A. The morning star pattern is a bullish pattern. It signals a potential reversal from a downtrend to an uptrend, which is the opposite of the bearish evening star pattern.
Q. How often should I monitor my positions when trading crypto using the Morning Star pattern?
A. It's important to keep an eye on your positions and monitor the market for any changes. If the market starts to move against your position, consider closing the position to minimize potential losses. The frequency of monitoring positions may vary depending on the volatility of the market, the size of the trade, and the trader's risk appetite.
Q. Can the morning star pattern appear on any chart timeframe?
A. Yes. The morning star pattern can form on any timeframe, from 1-minute crypto charts to weekly charts, though patterns on higher timeframes are generally considered more significant than the same formation on very short timeframes.