Moving Averages (MA) Explained: SMA vs EMA in Crypto Trading

A Moving Average (MA) is a technical indicator that smooths out price data by calculating the average price of an asset over a set number of periods, helping traders spot the underlying trend direction. The two most common types are the Simple Moving Average (SMA), which weights all periods equally, and the Exponential Moving Average (EMA), which weights recent prices more heavily and reacts faster to price changes.
Charles Dow, a prominent journalist and the founding figure of the Wall Street Journal, was one of the first people to point out that some market trends keep repeating themselves, and if monitored, they can give traders and investors an idea of what the future of a financial product or the overall market looks like.
This was the origin of technical analysis: the method of using past market data (like market demands, market sentiment, trader experience and expectations etc.) to figure out the future of the market.
Technical analysis is based on the theory that in terms of market trends, history repeats itself. So technical analysis suggests that when you see the market following a particular trend, there’s a good chance it’s repeating a trend seen before. Technical analysis was initially used in the traditional financial markets, but in the past decade, crypto traders have started using the method to predict when they can enter the market for a profitable trade.
The tools traders use for technical analysis are called technical indicators. There are quite a few of these technical indicators out there, of which the moving average is one. In this post, we give you a detailed look at this particular technical indicator, and how it works.
Key Takeaways
- The simple moving average is best for the long term, while the exponential moving average's best for the short term.
- To help traders during trending markets, MAs act as dynamic support and resistance.
- Always use moving averages with proper risk management, and try not to use them as a replacement.
What are Moving Averages in Crypto Trading?
Moving averages are one of the most used crypto trading indicators. Their job is to calculate a crypto asset’s average during a specific period. These numbers actually make it easier for investors to see the market’s direction.
Investopedia describes a moving average as a calculation that updates the average price of an asset continuously over a period of time. In crypto, this matters more than in stocks, since coins trade around the clock with no closing bell and prices move constantly. A moving average filters that noise into something you can act on.
How Does Moving Average Work?
Moving averages are customizable trading indicators, so a crypto trader can adjust the time period when they’re calculating an average, depending on their various trading objectives. It’s important to keep in mind that for short-term trading, relatively shorter moving averages are used, while for long-term trading, investors tend to use longer-term moving averages.
Some of the most commonly time periods while calculating moving averages are 15, 20, 30, 50, 100, and 200 days. The shorter the time frame you use to generate your moving average, the more sensitive it is to the shift in prices. On the contrary, the longer your time frame, the less sensitive the moving average is to price changes. However, there’s not really a set time span you must use in your moving averages. Over time, you can experiment with a number of time periods and find out for yourself what suits your objective best. When the moving average is rising, it implies that the crypto you’re analyzing is in an uptrend. And as you can probably guess, a dropping moving average symbolizes the crypto asset is caught in a downtrend.
Types of Moving Average:
Traders and investors use quite a few different kinds of moving averages according to the nature of the trade they intend to make. However, there are two distinct types of moving averages generally in use for technical analysis. These categories are the SMA or simple moving average, and the EMA or exponential moving average. Below, we discuss the two types. In accordance with your trading goals, you can pick out which one is more likely to prove more advantageous for you.
Simple Moving Average (SMA)
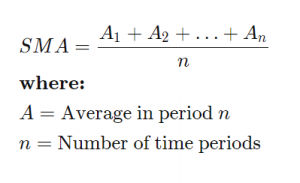
The SMA, as the name suggests, is literally the simplest of the various forms of moving averages. The simple moving average is deduced by calculating the average of any given set of values. So, it’s basically adding up a set of numbers- like the various prices of a crypto during a specific time period, and then dividing it by the number of prices included in the data set.
What’s the difference between the SMA and just the average of the prices taken? Well, it’s just the fact that as soon as there’s a new data point, the oldest data point in the set is not taken into account anymore. So if you’ve set your moving average to calculate the average of the past 20 days’ worth of price info, it’s always being updated and discarding older data the moment new data is being inputted. This way, the moving averages always stay up to date.
In the image below, you can see the formula for a SMA:
Exponential Moving Average (EMA)
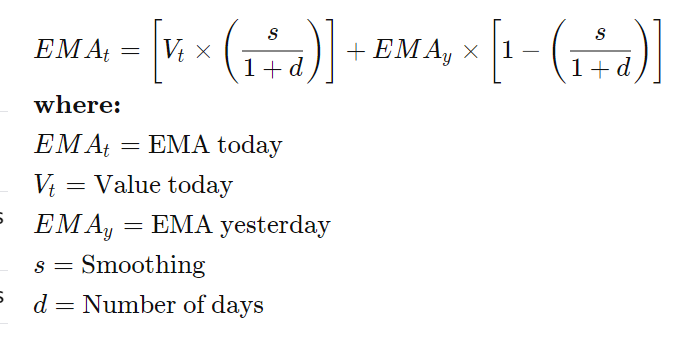
The EMA is not much unlike the SMA; this technical indicator too uses past price shifts of a crypto to produce an average for the trader. However, the main difference between the SMA and the EMA is that an EMA puts more importance to the recent most prices, so the resulting average is way more responsive to newer data. Both the SMA and exponential moving average are widely used by crypto traders both new and experienced; it’s undeniable though that the EMA is the technical indicator that is better for rooting out sudden price changes and reversals. And because of this particular quality of the EMAs, traders wanting to enter short-term trades prefer them.
You can find the formula used for calculating EMAs in the picture below:
SMA vs. EMA comparison table
How MAs Act as Support and Resistance
One reason why traders rely on moving averages is that they act as dynamic support and resistance. MAs move with the new price and adapt to the changing conditions. In a strong trend, the price often dips towards a widely watched MA, like the 50-day or 200-day, and bounces back, rather than breaking through. Because enough traders are following and buying near that line.
This isn’t something theoretical at all. In March 2025, BTC fell below its 200-day moving average. Recovered back near $83,700 and used it as support to hit $85,000 within days. But by May 2026, that changed again. BTC traded near the confluence zone around $82,000-$85,000, and that zone held as resistance instead.
Common Mistakes When Using Moving Averages
Moving averages are one of the useful technical indicators, but fully relying on them has its own risks.
- Relying only on moving averages without other tools creates long-term exposure.
- Acting on every MA crossover without waiting for confirmation.
- Ignoring market trends and the volatility factor.
- Trading without proper risk management and stop-loss.
Final Thoughts
Moving averages remain one of the most trusted indicators. But they don’t call the exact top or bottom. What they do is cut through the noise for you, so that you’re reacting to a trend, and not a candlestick. In my opinion, start with a 50-day SMA and a 12-period EMA, and watch how price behaves around both for a couple of weeks, then start building it from there.
To learn more about the crypto market, visit us at Delta Exchange India and follow us on X for the latest insights.
FAQs
Q1: What is a moving average indicator?
A moving average (MA) is a technical indicator that smooths price data by calculating the average price of an asset over a set number of periods. It helps filter short-term noise and reveal the underlying trend direction. Moving averages are among the most widely used indicators in crypto trading on platforms like Delta Exchange.
Q2: What is the formula for a moving average?
For a Simple Moving Average (SMA), add the closing prices for N periods and divide by N. For example, a 10-day SMA equals the sum of the last 10 closing prices divided by 10. An Exponential Moving Average (EMA) follows a similar concept but applies a multiplier that gives more weight to recent prices, making it more responsive to market changes.
Q3: What are the types of moving averages?
The main types include Simple Moving Average (SMA), which assigns equal weight to all periods; Exponential Moving Average (EMA), which gives more weight to recent prices and reacts faster; Weighted Moving Average (WMA), which applies linear weighting to prices; and Hull Moving Average (HMA), designed to reduce lag further. EMA is widely used among crypto traders due to its responsiveness.
Q4: How are moving averages used in trading strategies?
Moving averages are used to identify trend direction (price above MA suggests an uptrend, while below suggests a downtrend), generate crossover signals (for example, the 50-day MA crossing above the 200-day MA forms a golden cross, often viewed as bullish), and act as dynamic support or resistance levels. On Delta Exchange, traders commonly use the 20, 50, and 200-period moving averages on BTC and ETH charts.
Q5: What are common moving average settings for trading?
Common settings vary by trading style. For swing trading, traders often use the 20-period and 50-period EMA for entries and the 200-period EMA for trend direction. For day trading, the 9-period and 21-period EMA are commonly used on shorter timeframes such as the 15-minute or 1-hour chart. The golden cross (50/200 MA) and death cross remain widely watched long-term signals in Bitcoin and ETH markets.