Optimising Returns: Pairing MA Crossovers with a Trend Indicator

Overview
Trading in the market requires a tactical edge—a strategy that adapts to the ever-changing market dynamics. This report delves into how a simple enhancement to the classic Moving Average (MA) Crossover approach can significantly boost trading performance.
What is the Moving Average Crossover Strategy?
A traditional Moving Average (MA) strategy is a technique traders use to identify trends in the price of an asset, like Bitcoin. It involves using moving averages, which are the average prices of the asset over a specific number of days. Here's a straightforward breakdown of how it works:
- Fast and Slow MAs: You have two MAs, a fast and a slow one. The fast MA might calculate the average price over a shorter period, like the last 10 days, and the slow MA might use a longer period, like the last 50 days.
- Crossover Signals: When the fast MA crosses above the slow MA, it suggests that prices are trending upward, signaling a buying opportunity. Conversely, when the fast MA crosses below the slow MA, it might indicate that prices are trending downward, signaling a selling point.
We've meticulously backtested the MA crossover strategy against Bitcoin's ebbs and flows from January 1, 2022, to November 5, 2023. The data speaks volumes, inviting a deeper understanding of market behaviors and strategy performance.
Quantity Traded: 1 BTC
MA Crossover traded BTCUSDT Futures
| SMA1 | SMA2 | Total Net PnL | Total Fees Paid | Number of Trades |
|---|---|---|---|---|
| SMA10 | SMA20 | $4,998.59 | $25,958.92 | 931 |
| SMA10 | SMA50 | -$1,261.47 | $13,290.47 | 479 |
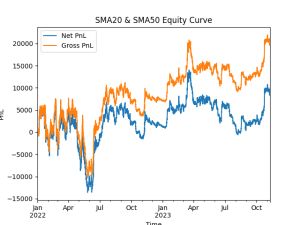
| SMA20 | SMA50 | $9,949.17 | $11,310.83 | 411 |
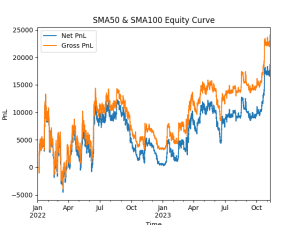
| SMA50 | SMA100 | $18,711.29 | $5,367.71 | 200 |
| SMA100 | SMA250 | $3,098.79 | $2,086.21 | 78 |
Note: The Net PnL values have been calculated after deducting fees, ensuring a transparent view of the strategy's profitability.
Enhancing with Market Sentiment: MA Crossover Plus Funding Rate Indicator
We've refined the strategy, tuning into the market's rhythm with a funding rate indicator — assuming rates above 5% signal bullish tides and below -5%, a bearish swing. Only the trades that align with these sentiments are considered. For example, we ignore the signal if the sentiment is bullish according to the funding rate and the MA crossover suggests a short trade.
Refined Strategy with Market Sentiment Filter:
| SMA1 | SMA2 | Total Net PnL | Total Fees Paid | Number of Trades |
|---|---|---|---|---|
| SMA10 | SMA20 | $20,422.29 | $8,520.21 | 590 |
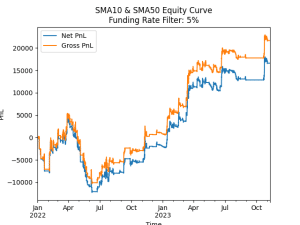
| SMA10 | SMA50 | $16,620.42 | $5,051.08 | 354 |
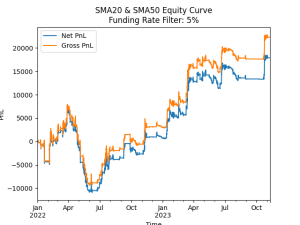
| SMA20 | SMA50 | $17,900.63 | $4,407.87 | 308 |
| SMA50 | SMA100 | $19,480.14 | $2,613.86 | 192 |
| SMA100 | SMA250 | $11,700.30 | $1,579.20 | 120 |
Note: The Net PnL values have been calculated after deducting fees, ensuring a transparent view of the strategy's profitability. Intrigued by this strategy? Want to apply ?
Comparative Analysis of Equity Curves
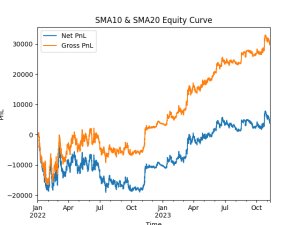
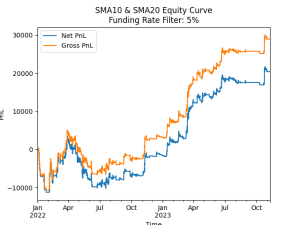
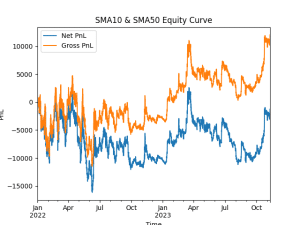
Yellow Line: Gross PnLBlue Line: Net PnL (Gross PnL - Fees)
Equity Curve: SMA10 vs. SMA20 Pairing
Equity Curve: SMA10 vs. SMA50 Pairing
Equity Curve: SMA20 vs. SMA50 Pairing
Equity Curve: SMA50 vs. SMA100 Pairing
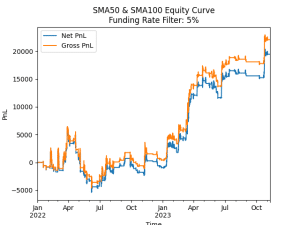
Deploy the 50/100 MA Crossover on your Delta Exchange account with Tradetron https://tradetron.tech/strategy/3800997
Equity Curve: SMA100 vs. SMA250 Pairing
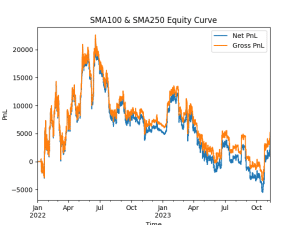
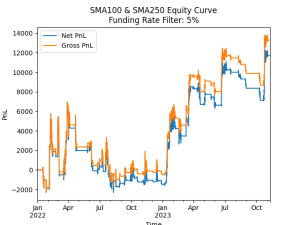
Implementing the market sentiment filter through the funding rate indicator further refines this curve. The result is a more stable increase in equity, signifying steadier returns and reduced risk exposure. Both equity curve comparisons demonstrate the added value of incorporating market sentiment into the MA Crossover strategy. By filtering trades against the identified market momentum, our strategy mitigates undue risk and capitalises on a more consistent growth pattern.
Insights at a Glance
Our analysis revealed that:
- The traditional MA Crossover strategy often falls prey to market noise, resulting in more losing trades.
- Incorporating a funding rate indicator refined our trade execution, aligning it with market momentum and significantly improving trade outcomes.
- Across all SMA pairings, the enhanced strategy increased Net PnL and lowered the volatility of returns, indicating an improved risk-adjusted return.
Final Thoughts
By marrying the MA Crossover strategy with a keen understanding of market sentiment through the funding rate indicator, traders can pivot from a scattershot approach to a targeted, high-precision strategy. This report underscores the importance of an adaptable trading plan that leverages the synergy of indicators to carve out a path to consistent profitability in the dynamic world of Bitcoin trading. We Value Your Insights! Your trading journey is unique, and we’re keen to explore strategies that resonate with you. Share your curiosities and interests in the comments — your input could spark our next analytical deep dive. Together, let’s uncover the strategies that will shape future market victories. Interested in automating this strategy on your account? Let us know
Frequently Asked Questions (FAQs)
Q1: What is a moving average crossover strategy in crypto trading?
Answer: A moving average crossover happens when a shorter-period MA crosses above or below a longer-period one, pointing to a possible trend shift. The 50/200 combination is the most widely used: a golden cross (short over long) suggests bullish momentum, while a death cross points to bearish pressure.
Q2: How do MA crossovers generate buy and sell signals?
Answer: A buy signal triggers when the faster MA crosses above the slower one; a sell fires on the reverse. Crossovers lag price by design, so traders on Delta Exchange often pair them with funding rate data to filter out weak, momentum-chasing entries.
Q3: What is a funding rate indicator and how does it reflect market sentiment?
Answer: Funding rates are periodic payments exchanged between long and short holders in perpetual futures contracts, keeping prices tethered close to spot. Persistently positive rates signal crowded long positioning; consistently negative rates suggest the market is leaning heavily short and bracing for a drop.
Q4: How does combining MA crossover with a trend indicator improve trading performance?
Answer: Layering a funding rate filter on top of MA crossover signals helps avoid entries when sentiment is already stretched, where reversals are more likely than continuations. The combination cuts whipsaws and improves win rate without adding meaningful complexity to the strategy.
Q5: What are the benefits of using sentiment filters in trading strategies?
Answer: Sentiment filters help separate real trend momentum from crowded, fragile moves that tend to snap back fast. Taking crossover signals only when sentiment is not at an extreme typically reduces the risk of getting caught in sharp, positioning-driven reversals that gut trend-followers.
Q6: How can traders automate MA crossover strategies on platforms like Delta Exchange?
Answer: Delta Exchange offers API access for algorithmic trading, letting you automate MA crossover strategies with precise trigger conditions, including crossover confirmation paired with a funding rate threshold. Orders run automatically across BTC, ETH, and other pairs, removing manual execution and emotional bias from the process.