Research
Weekday Seasonality Report on Bitcoin (BTC)

Yash Dalal
October 27, 2023
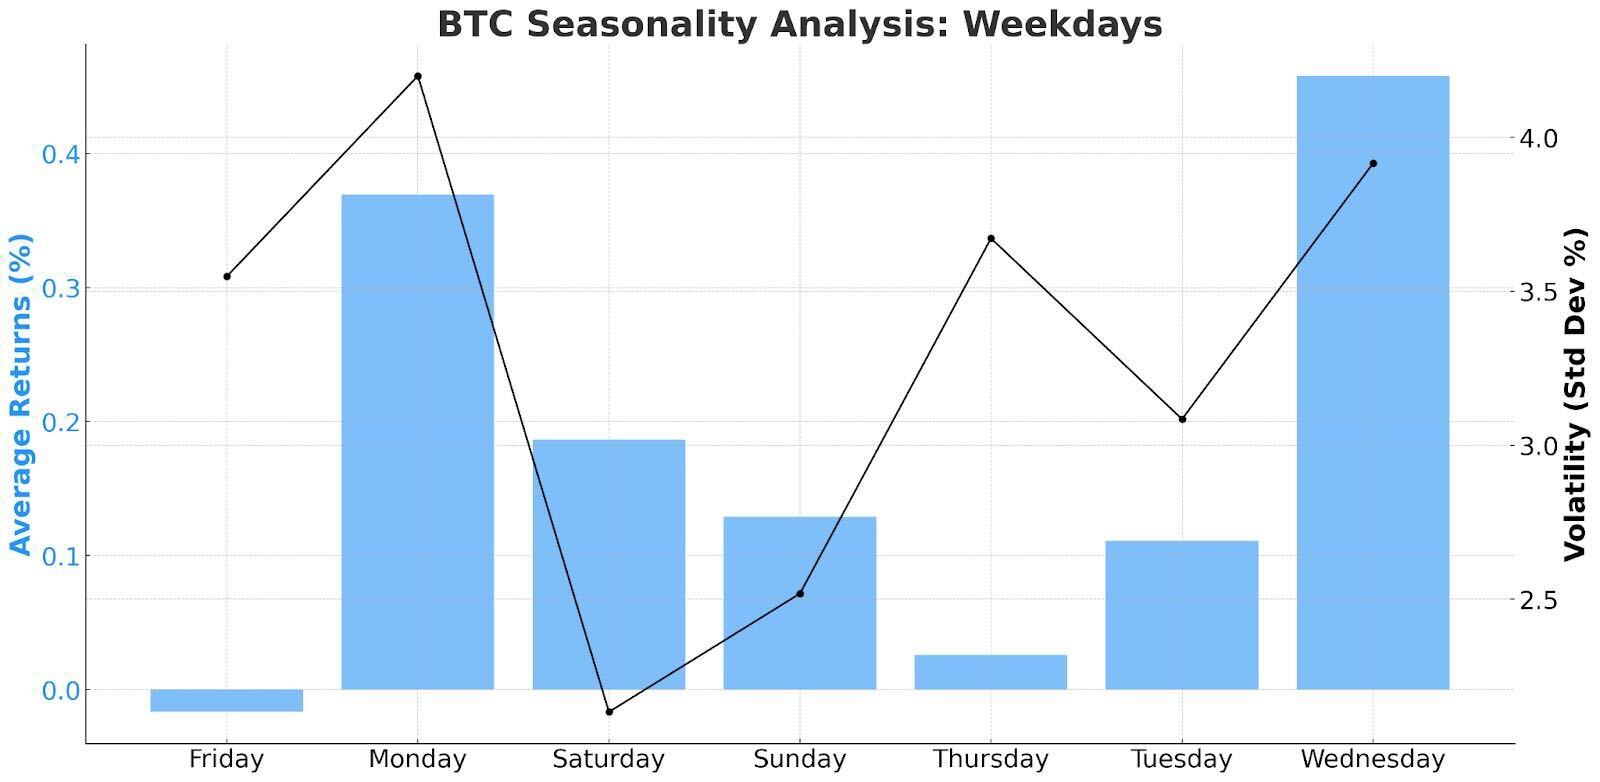
Here's the visualisation showcasing the seasonality analysis for Bitcoin based on weekdays:Blue Bars: Represent the average returns for each weekday.Black Line: Denotes the volatility (standard deviation) of the returns. A higher value indicates higher price fluctuations on that day.The average daily returns for Bitcoin on different weekdays are as follows:
| Monday | 0.37% |
| Tuesday | 0.11% |
| Wednesday | 0.46% |
| Thursday | 0.03% |
| Friday | -0.02% |
| Saturday | 0.19% |
| Sunday | 0.13% |
Volatility (Standard Deviation) of Returns by Weekday:
| Monday | 4.20% |
| Tuesday | 3.09% |
| Wednesday | 3.92% |
| Thursday | 3.67% |
| Friday | 3.55% |
| Saturday | 2.13% |
| Sunday | 2.52% |
Number of Green Days vs. Red Days by Weekday:
| Greens | Reds | |
| Monday | 94 | 92 |
| Tuesday | 98 | 88 |
| Wednesday | 98 | 88 |
| Thursday | 84 | 102 |
| Friday | 88 | 98 |
| Saturday | 99 | 87 |
| Sunday | 93 | 93 |
Key TakeawaysHighest Average Returns:
- Wednesdays have the highest average return, suggesting it might historically be the most profitable day to hold Bitcoin.
Positive Momentum Start:
- Mondays also show strong average returns, indicating the week often starts with positive momentum.
Weekend Stability:
- Saturdays have the lowest volatility, hinting at more stable prices on this day.
Midweek Volatility:
- Mondays and Wednesdays exhibit higher volatility compared to other weekdays, implying larger price fluctuations and potentially higher risk or opportunity on these days.
End-of-Week Caution:
- Thursdays and Fridays show a slight decline in average returns. Particularly, Thursdays have higher days with negative returns, suggesting caution for end-of-week trading.
Overall Trend:
- Despite some variability in returns across weekdays, Bitcoin has shown positive average returns on most days, reinforcing its strong upward trend over the period analysed.
https://poll.fm/12914541