
The Algo Trading Strategy, which made 2860% returns in the past 2 Years!

What if you sold a straddle daily for the past two years (January 2022 to December 2023)?
- How would your capital have grown?
- What levels of risk would you have been exposed to?
By the end of this read, you will have a comprehensive understanding of:
- The Strategy's Overall Performance:
- Cumulative profit curve showing the growth or decline in capital over time.
- Equity curve factoring in compounding effects on an initial $5,000 capital. (Doubling Quantity every time the capital doubles)
- Risk and Return Profile:
- Drawdown curve illustrating the strategy's risk through the deepest capital dips.
- Distribution of Profit and Loss (PNL) to understand the frequency and magnitude of wins and losses.
Through detailed graphs and statistics, this report aims to provide traders and analysts with a clear picture of what to expect if they were to implement a daily straddle selling strategy. Whether you're a seasoned trader or just starting, this report is designed to give you the critical insights needed for informed decision-making in the dynamic world of options trading.
Description of Trading Strategy Underlying Asset: Bitcoin (BTC) Strategy Type
- Daily ATM Straddle Selling
- A straddle involves simultaneously selling a call and a put option of the same underlying asset, expiration date, and strike price.
Trade Execution
- Trades are executed daily, 6 hours before the expiry of the options. I.e. 11:30 AM IST
- The strategy aims to capitalize on the rapid theta decay close to the options' expiration.
- ATM Strike is calculated as the closest to the money strike from the available option contracts at the time of execution.
Position Sizing
- Consistent trade size of 1 BTC in the non-compounded strategy.
- In the compounded strategy, the trade size adjusts linearly with the capital, increasing as the capital doubles and decreasing as the capital dips.
Capital Management
- Starts with an initial capital of $5,000 in the compounded strategy.
- Capital is reinvested into the strategy, increasing or decreasing the position size based on the current capital. Quantity is increased by 1 BTC every time the capital increases by $5k.
Risk Management
- The strategy inherently involves high risk and high reward due to the nature of selling straddles.
- Profit and Loss (PNL) are closely monitored, with cumulative PNL calculated daily.
Fees
- The strategy considers the total fees paid and calculates the Net Profitability accordingly.
Objective
- The primary aim is to generate consistent returns by exploiting the time decay of options close to expiry while also managing the risks associated with sudden price movements in the underlying asset.
Key Metrics and Insights
- Compounding Strategy ROI: 2860% in 2 Years
- Total Trades: 723
- Win Rate: 66.53%
- Max Profit in a Single Trade per BTC Traded: $765.28
- Max Loss in a Single Trade per BTC Traded: $-1263.13
- Average Profit per Winning Trade per BTC Traded: $132.32
- Average Loss per Losing Trade per BTC Traded: $-163.05
- Profit Factor: 1.61, suggests that the total profits from winning trades are approximately three times the total losses from losing trades
- Average Fees per Trade: $29.00
Cumulative Profit Graphs
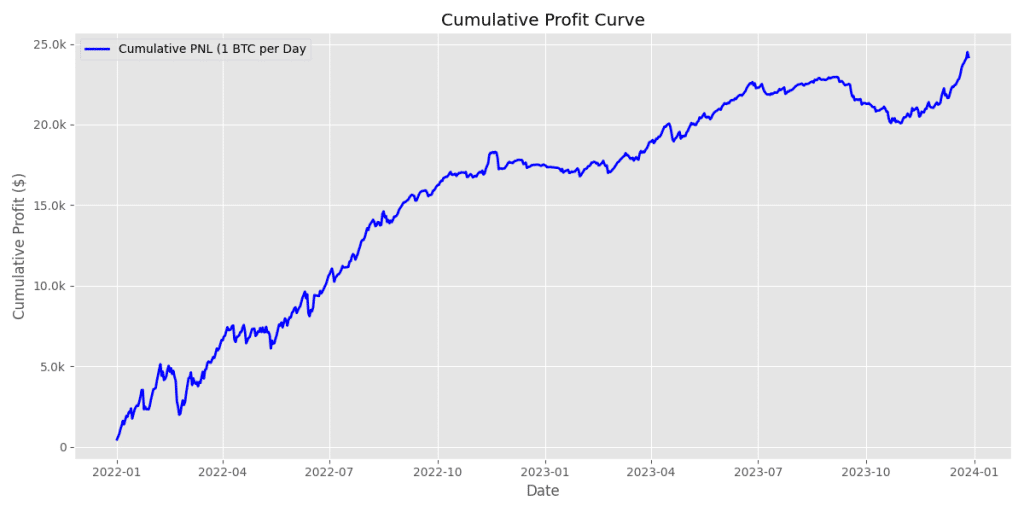
- The graph depicts the progression of profits and losses over time without considering any changes in trading quantity.
- Initial Capital: $5,000, with a constant quantity traded throughout the period at 10x Leverage
- This curve gives you a straightforward understanding of what would happen if you kept your trading size consistent, regardless of the capital fluctuations.
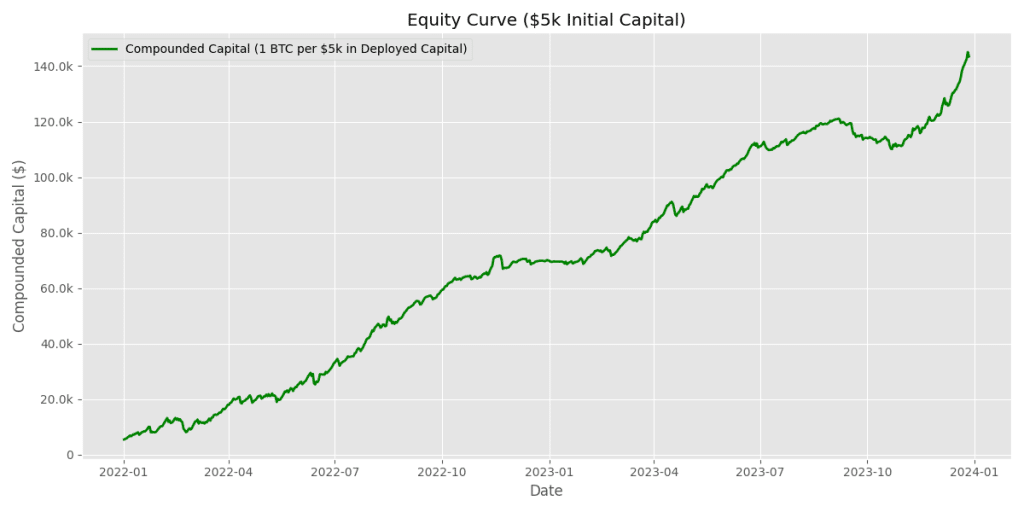
- Here, the curve shows the effect of compounding on equity, with the trading quantity doubling each time the capital doubles.
- Initial Capital: $5,000, with the size of trades increasing linearly for every doubling of capital
- This dynamic adjustment to trading quantity aims to reflect a more aggressive reinvestment strategy and shows how capital could grow under such conditions.
Do you want to automate this strategy on your Delta Exchange account? We have curated a Tradetron strategy that you can subscribe to and have Tradetron sell straddles on your account daily at 11:30! Link to Strategy New to automated trading? No problem! Our comprehensive integration blog will walk you through connecting Tradetron with your Delta account. Integration Blog Both graphs are critical in understanding the nature of returns and the impact of strategic reinvestment.
Risk and Return Profile
Drawdown Curve: This graph is critical for understanding the most significant loss the strategy might experience from a peak. It helps in assessing the risk tolerance required for the strategy. The drawdown curve for the past two years will illustrate the deepest dips in the capital, providing a realistic sense of the potential losses over specific periods.
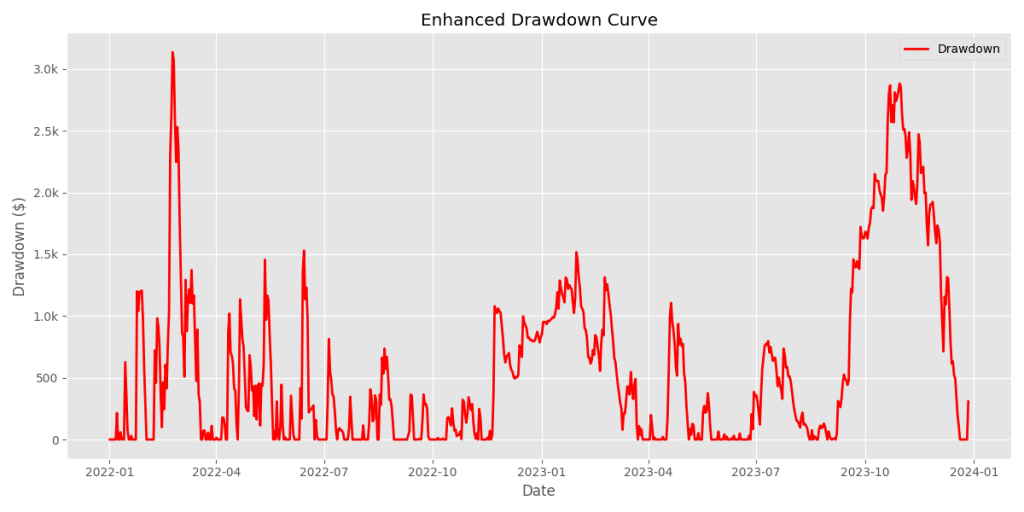
- Maximum Drawdown Observed: The graph indicates the most significant single drop in capital, also known as the maximum drawdown, was over $2,500. This is a significant risk factor as it represents the most substantial loss the strategy experienced from a peak during the backtesting period.
- Frequency of Substantial Drawdowns: The drawdown curve shows numerous occurrences where the drawdown exceeded $1,000, suggesting that the strategy regularly encounters periods of significant losses relative to its capital.
- Recovery Periods: The width of the spikes in the graph hints at varying recovery periods, with some drawdowns persisting over more extended periods. Traders must assess their comfort with such potential holding periods during losses.
PNL Distribution: This analysis offers insight into the frequency and magnitude of wins and losses. It helps understand the volatility and risk-return profile of the strategy. The PNL distribution graph will show how often specific ranges of PNL were achieved and the spread of these outcomes, indicating the strategy's consistency and risk.
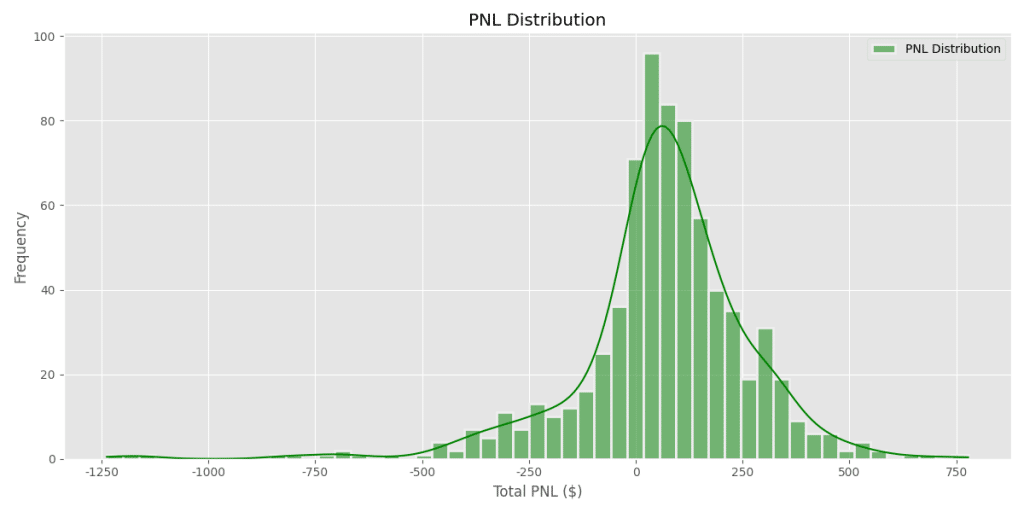
- Most Common PNL Range: The highest frequency of trades occurs in the range of approximately $-250 to $250, which likely represents the strategy's typical outcome per trade.
- Large Losses: There are occurrences of losses greater than $1,000, but these are relatively infrequent compared to smaller losses.
- Large Gains: Similarly, gains greater than $500 occur but are less frequent than smaller gains, which aligns with the expected payoff profile of a straddle selling strategy.
Do you want to automate this strategy on your Delta Exchange account? We have curated a Tradetron strategy that you can subscribe to and have Tradetron sell straddles on your account daily at 11:30! Link to Strategy New to automated trading? No problem! Our comprehensive integration blog will walk you through connecting Tradetron with your Delta account. Integration Blog
Disclaimer
This report is for informational purposes only and does not constitute financial, investment, or trading advice. The backtest results are based on historical data and do not guarantee future performance. Trading in options involves a high level of risk, including the total loss of investment. You should consult with a qualified professional for investment advice suited to your personal circumstances. The authors or distributors of this report bear no responsibility for any actions based on the information provided herein.
Conclusion
You should now understand the daily ATM straddle selling strategy on Bitcoin options. This report provided insights into the strategy's overall performance, including the cumulative profit over time, the impact of compounding on equity, and the risk-return profile through drawdown and PNL distribution analysis. Whether you're a seasoned trader or just starting, this detailed analysis aims to provide you with the critical insights needed for informed decision-making in options trading. Remember that all strategies carry risks; past performance does not indicate future results. Always consider your risk tolerance and investment objectives when trading.
Frequently Asked Questions (FAQs)
Q1. What is a daily ATM straddle selling strategy in Bitcoin options trading?
Answer: A daily ATM straddle means selling both an at-the-money call and putting on Bitcoin with the same strike and same expiry, usually same-day. The position profits when BTC barely moves before expiry, so the full premium collected stays in the seller's pocket.
Q2. How does a straddle selling strategy generate returns in crypto derivatives markets?
Answer: Returns come from theta decay. Options bleed time value as expiry gets closer, and if Bitcoin's actual price movement stays smaller than the implied volatility priced into the options, the seller keeps more premium than they pay out. High IV environments offer bigger premiums but carry more risk.
Q3. What are the risks and drawdowns involved in straddle trading strategies?
Answer: The main risk is a large directional move that wipes out the collected premium. Bitcoin regularly moves 5-10% in a single day around major macro events or supply shocks like halvings. Short-volatility strategies can rack up losses fast, and drawdowns tend to be sharp rather than gradual.
Q4. How does compounding impact returns in automated options trading strategies?
Answer: Compounding puts profits back into bigger position sizes each cycle. Returns can grow quickly during a winning run, but the same mechanic amplifies losses when the strategy hits a rough patch. The 2860% return figure in the blog likely assumes aggressive full compounding, which is not suitable for every risk appetite.
Q5. What is the role of theta decay in options strategies like straddle selling?
Answer: Theta measures how much an option loses in value each day as expiry approaches. Straddle sellers collect that decay, so time working against the buyer works in their favour. Delta Exchange offers daily-expiry BTC options, which lets systematic traders harvest theta on a short cycle while managing directional exposure.