What is Moving Average Convergence Divergence (MACD)?

MACD (Moving Average Convergence Divergence) is a trend-following momentum indicator built from two exponential moving averages (EMAs), typically the 12-period and 26-period EMA.
It has three parts: the MACD line, the signal line, and the histogram. Traders use it to spot momentum shifts, confirm trend reversals, and generate buy/sell signals through MACD crossovers and MACD divergence.
MACD, fully known as Moving Average Convergence Divergence, is a common and technical tool among traders used to identify price trends and movements in financial markets. The technical analysis indicator was first developed in 1981 by Gerald Appel, and is still in use, even 40 years later. Traders employ the use of the MACD due to its relevance in trading - it helps them identify opportunities in the market.
What is the MACD Indicator?
The MACD indicator measures the relationship between two moving averages of an asset’s price to reveal the direction, strength, and duration of a trend. It is made up of three components:
- MACD Line - the difference between the 12-period EMA and the 26-period EMA.
- Signal Line - a 9-period EMA of the MACD line, used to spot turning points.
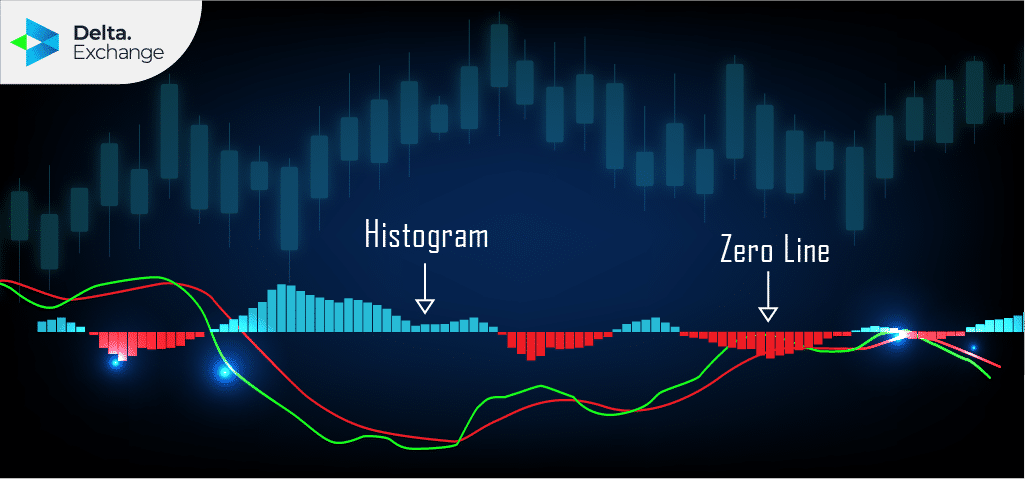
- Histogram - a bar chart showing the gap between the MACD line and the signal line.
How does the MACD Indicator Work?
The MACD is a trend-following momentum indicator. It is a handy tool for traders who want to interpret the direction, strength, momentum, and duration of a trend in the price of a crypto asset. Using three components - two moving averages and a histogram - the MACD indicator identifies trend direction and duration. The two lines within the indicator resemble simple moving averages (SMA) but are actually exponential moving averages (EMA).
The MACD creates a histogram that shows the difference between the two moving averages (the MACD Line) and the exponential moving average of those two moving averages (the Signal Line). The histogram moves upward or downward, depending on momentum, across the Zero Line. When the two moving averages move apart, they are ‘diverging.’ When they move closer together, they are ‘converging.’ Hence the name Moving Average Convergence Divergence.
MACD Crossover Explained
A MACD crossover happens when the MACD line crosses the signal line. When the MACD line crosses above the signal line, momentum is turning bullish, and traders may look for buying opportunities. When it crosses below, momentum is turning bearish. Crossovers that occur further away from the zero line are generally considered more significant.
MACD Divergence Explained
MACD divergence occurs when the price of an asset moves in the opposite direction to the MACD indicator. Bullish divergence forms when price makes a lower low while MACD makes a higher low, hinting at fading downward momentum. Bearish divergence forms when price makes a higher high while MACD makes a lower high, hinting at fading upward momentum. Divergence is often used to anticipate potential trend reversals.
Zero Line Crossover
A zero line crossover happens when the MACD line crosses above or below the zero line. A move above zero suggests the shorter-term EMA has overtaken the longer-term EMA, pointing to building bullish momentum. A move below zero suggests the opposite - building bearish momentum.
How to Read a MACD Chart
The histogram confirms the trend momentum of a crypto asset. For example, with Bitcoin, a histogram move above the zero line indicates an uptrend, while a move below the line points to a downtrend.
Traders will typically look to go long on Bitcoin when an uptrend is confirmed - that is, when higher highs and higher lows are being formed and resistance levels have been broken. Lower highs, lower lows, and broken support levels tend to indicate the opposite.
MACD Formula: How to Calculate MACD
A MACD chart is typically built around three numbers:
- Fast moving average (MACD Line) - the moving average of the more recent price bars.
- Slow moving average (Signal Line) - the moving average of the price bars over a longer look-back period.
- Histogram value - the difference between the two moving averages.
The MACD formula:
macd = ma(source, fast_length) – ma(source, slow_length)
signal = ma(macd, signal_length)
histogram = macd – signal
Where the exponential moving average (EMA) is the moving average (ma) commonly used, with the standard settings:
fast_length = 12
slow_length = 26
signal_length = 9
Advantages of MACD
- It’s a useful technical analysis tool that helps traders identify trading signals and opportunities.
- It can help verify trend reversals - a notable advantage over some other technical indicators.
- It keeps traders updated on the direction and duration of a trend.
- Since MACD is a relatively short-term indicator (based on EMAs of up to 26 periods), short-term traders often find it especially useful.
Disadvantages of MACD
- Long-term traders may find MACD less useful, since it’s built on shorter-term EMAs (up to 26 periods).
- Traders often need to fine-tune or search for a suitable MACD setting for each crypto asset.
- MACD is a lagging indicator - signals can arrive late, meaning traders may miss early profits before entering a position.
- It can produce false signals: MACD may indicate a momentum shift that doesn’t actually materialize in price.
MACD vs RSI vs Bollinger Bands
MACD, RSI, and Bollinger Bands are often used together because each measures something different - momentum direction, overbought/oversold conditions, and volatility, respectively.
Conclusion
Despite being a useful tool, the MACD can be misleading on certain occasions. In such instances, it is advisable to consult the MACD for trend momentum and duration alongside other technical indicators like stochastic oscillator, Bollinger bands and the Relative Strength Index (RSI). Moving Average Convergence Divergence is used for identifying three kinds of primary signals- Signal Line Crossover, Divergence and Zero Line Crossover.
FAQs
Q1: What is MACD in trading?
MACD, or Moving Average Convergence Divergence, is a momentum indicator that tracks the relationship between two moving averages of an asset’s price. Think of it as a tool that tells you not just where a trend is heading, but how much conviction sits behind it - making it a staple in crypto technical analysis.
Q2: How does the MACD indicator work?
MACD subtracts the 26-period EMA from the 12-period EMA to form the MACD line. A 9-period EMA, called the signal line, is then plotted over it. When the MACD line crosses above the signal line, momentum is turning bullish. Below it, bearish. The histogram simply visualises the gap between the two.
Q3: What is a good MACD value?
There is no universal “good” value - it depends entirely on the asset and timeframe you are watching. What traders actually look for are crossovers and divergences, not fixed numbers. A rising MACD well above zero suggests building bullish strength; a falling one deep below zero points to sustained bearish pressure.
Q4: What are the components of MACD?
MACD is built on three parts working together. The MACD line is the gap between the 12-period and 26-period EMAs. The signal line is a 9-period EMA smoothed over that. The histogram shows the distance between both lines. Each component adds a layer - trend direction, momentum, and timing.
Q5: What does a MACD crossover indicate?
A crossover is one of the clearest signals MACD offers. When the MACD line crosses above the signal line, it points to rising momentum and a possible buying opportunity. Cross below, and the tide may be turning bearish. These signals carry more weight when they occur well away from the zero line.
Q6: What is the difference between MACD and RSI?
RSI tells you whether an asset looks overbought or oversold on a fixed scale of 0 to 100. MACD, by contrast, has no fixed range - it focuses on trend direction and momentum through moving average crossovers. RSI is better for spotting reversals; MACD for confirming trends. Together, they make a stronger pair.