Volatility Skew in Crypto Derivatives Trading

Any trader worth their salt would engage in technical analysis of their financial markets and assets, regardless of the sector they are trading in. If we speak of technical analysis crypto in particular, one of the most relevant tools you can use is volatility skew in crypto derivatives trading. The level of volatility skew observed is a measure you may use to evaluate crypto options contracts, since volatility is indubitably one of the most crucial factors involved in options pricing. In this post, we find out all there is to know about volatility skew in crypto derivatives trading!
What is Volatility Skew?
As one of the most prominent technical indicators used by traders today, the volatility skew is essentially a graphical way of putting the implied volatility of crypto options that have different strike prices. For those not in the know, the strike price of a crypto option is basically the value at which a put or call option can be exercised. So when you trade in crypto options, you have to be extra careful in picking the strike price for your derivative of choice. This will, of course, have heavy implications for the end result of the crypto investment you make. Now, back to the volatility skew for crypto derivatives. Here are some key factors to know:
- It represents the implied volatility of crypto options; which is essentially a measure of how much the broader market expects the underlying asset’s value to change in the coming times.
- The volatility skew is measured with various crypto indicators, namely the VIX index (i.e. the CBOE or Chicago Board Options Exchange Volatility Index) and volatility cones.
More on Implied Volatility (IV)
To understand volatility skew in crypto trading, you have to make yourself familiar with the notion of implied volatility first. As we mentioned earlier, the IV is basically a knowledgeable forecast of the future value changes of a crypto. So in technical analysis of crypto, you can use IV to measure upcoming fluctuations in the price of a digital asset, and plan your crypto options trades accordingly. What are the basics of implied volatility that you need to know? Here’s our quick overview:
- Implied volatility is represented by the symbol σ, and it is denoted with a percentage and standard deviations throughout a given period of time.
- IV is calculated with the Black-Scholes model for option pricing, which takes into account six variables (volatility, option type, price of underlying asset, time, strike price, and risk-free rate) to determine the fair price for a certain crypto options contract.
- Now, as per the Black-Scholes model, all crypto options are supposed to have the same IV despite different strike prices and expiration dates. In practice, this is untrue, and the strike price and expiration date are in fact two major factors when calculating the implied volatility of crypto options.
How Does the Volatility Skew in Crypto Derivatives Appear on the Chart?
The volatility skew in crypto options trading is a graph, and a curve is there to represent the relationship between the strike price and implied volatility for certain crypto options with the same expiry. The curve pictured below is known as a volatility smile, since it looks a lot like a smile.
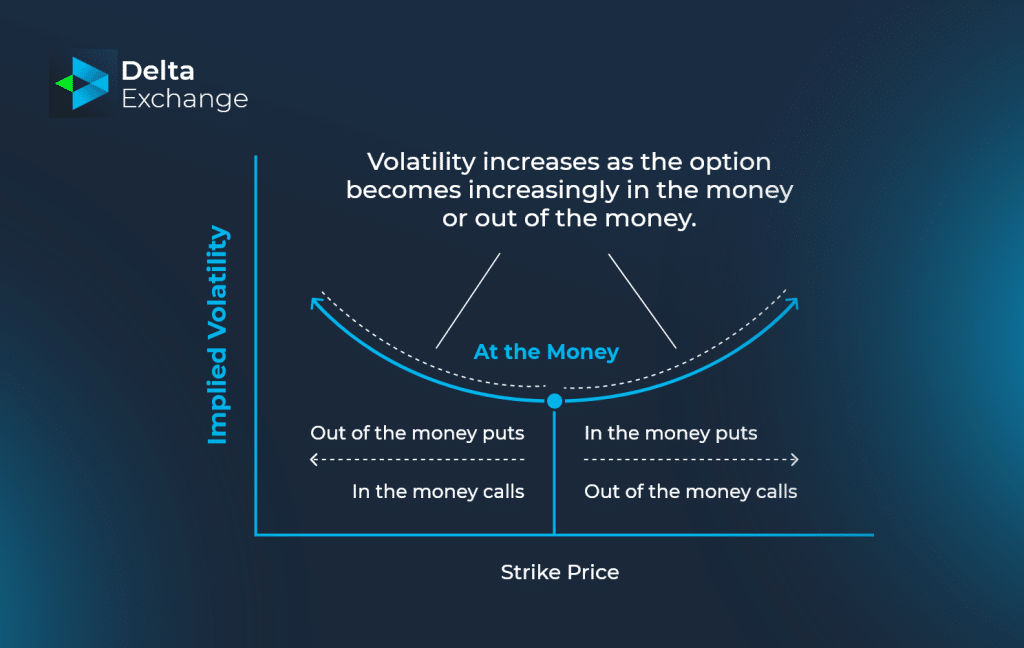
The volatility smile; volatility skew in crypto options trading. You can say that the volatility skew actually represents the difference in the IV among ITM (in-the-money), OTM (out of the money), and ATM (at the money) crypto options. As the image above shows for a volatility smile, the ITM and OTM have higher volatility rates than ATM options. ITM is, of course, a crypto option with a potential profit opportunity derived from the relationship between the strike price and current price. An option is in the money when the current market price for the underlying crypto is above the strike price for a call and below the strike price for a put option. Conversely, a crypto option is said to be out of the money when the current price of the underlying crypto is below the strike price for a call or above the strike price for a put option. An at the money option has the same strike price as the current market value of the underlying crypto. A volatility skew is asymmetrical and akin to a smirk, as opposed to the ‘smile’ above.
Read More: Deep OTM/ITM Options
How to Measure Volatility Skew in Crypto Trading?
To use this one of the popular crypto indicators today, you simply need to plot points with varied IV of option strike prices on the graph.
Trading with Volatility Skew in Crypto Options
When you’re using this technical indicator for technical analysis crypto, it’s important to note when the curve on the chart becomes asymmetrical. Here’s what you need to know to trade with it:
- The shape of the volatility smirk or skew can tell you the price direction of the underlying asset.
- The magnitude of the resulting curve can show the strength of the movement being observed.
- The direction of the volatility skew’s shift is expected to lead the movement of price quotations in that direction as well.
- If a sharp price drop is expected, the IV of OTM put options can be greater than that of OTM calls. In this scenario, the left side of the volatility skew is elevated.
- On the contrary, if the right side of the volatility smirk is elevated, it is expected to herald a sharp upward move in the value of the underlying crypto, and can be interpreted as a buy signal.
If technical analysis of the financial markets is your goal, the volatility skew can therefore be most informative.
Terminology Associated with Volatility Skew
Here are some closely associated terms with these crypto indicators:
- Horizontal Skew: This occurs when accounting for crypto options with the same strike price but different dates of expiry.
- Vertical Skew: This, in turn, happens when accounting for crypto options with varied strike prices but the same expiration date.
- Reverse Skew: In long-term crypto options, the IV for options with lower strike prices is higher than those with bigger strike prices. The resulting volatility skew is known as a reverse skew, and it implies that ITM calls and OTM puts are comparatively more expensive than OTM calls and ITM puts.
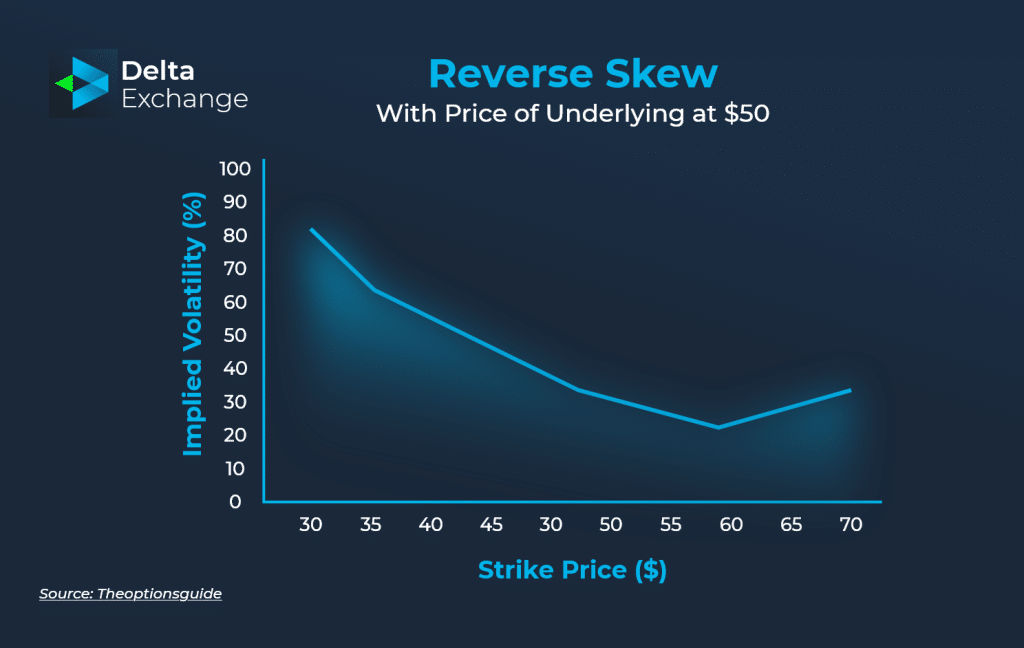
Reverse volatility skew
- Forward Skew: If options with lower strike prices have lower IV than options with bigger strike prices, a forward skew occurs. Conversely to the previous type, this one poses OTM calls and ITM puts as more expensive than ITM calls and OTM puts.
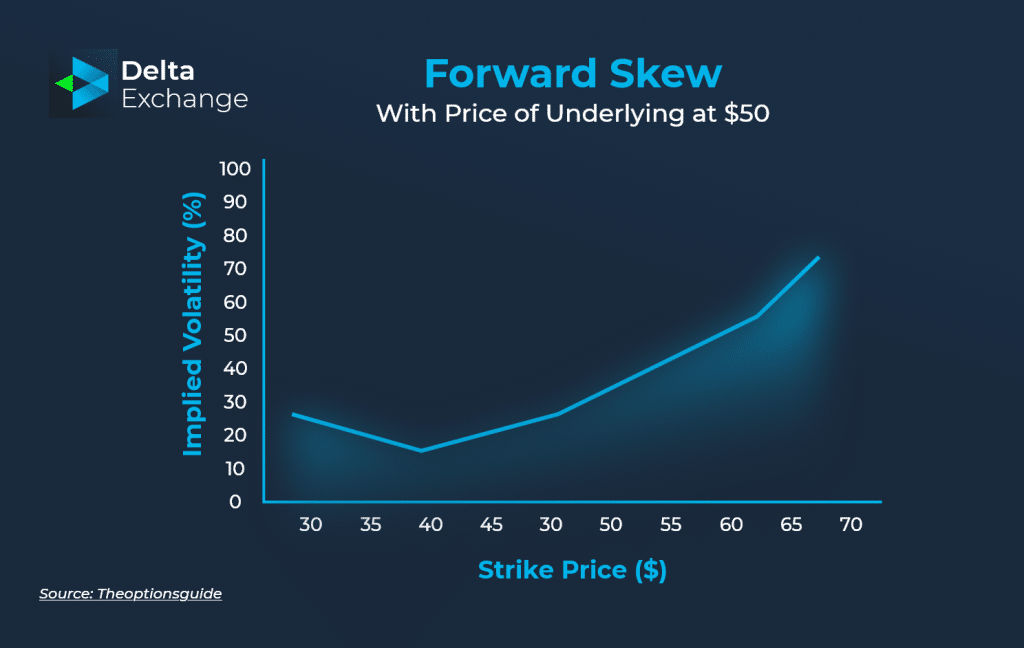
Forward volatility skew
Volatility Skew for Technical Analysis in the Financial Markets
In terms of technical indicators, volatility skew is unmatched, and the charts can tell you all about the relevancy of a certain options contract for your crypto trading strategy. Further, any deviations from normal volatility smirk patterns can help you predict future price movements for crypto, as well as options that have certain cryptos as their underlying assets.
Frequently Asked Questions (FAQs)
Q1: What is volatility skew in crypto trading?
Answer: Volatility skew is the asymmetry in implied volatility across options at the same expiry but different strikes. In crypto, puts usually carry higher IV than equivalent calls because traders pay more for downside protection, and that gap tends to widen sharply during bearish or risk-off periods.
Q2: What is implied volatility (IV) in crypto options?
Answer: IV is what the market expects future volatility to look like, derived from live options premiums using models like Black-Scholes. Unlike historical volatility, which measures past price moves, IV reflects forward-looking consensus. On Delta Exchange, IV is a key input when selecting options strategies and assessing contract value.
Q3: How does the volatility smile appear on a chart?
Answer: A volatility smile appears as a U-shaped curve when you plot IV against strike prices at the same expiry. Both deep ITM and deep OTM options trade at higher IV than ATM options, reflecting demand for tail-risk protection at both ends of the expected price range.
Q4: What is the difference between ITM, OTM, and ATM options?
Answer: ATM options have a strike near current spot price. ITM options carry intrinsic value: a call with a strike below spot, or a put above it. OTM options hold no intrinsic value and rely purely on time and volatility, making them cheaper but dependent on a meaningful directional move.
Q5: How is volatility skew measured in crypto trading?
Answer: The 25-delta risk reversal is the standard way to measure skew. It compares implied volatility of the 25-delta call versus the 25-delta put at the same expiry. Positive values mean calls are pricier, signaling bullish skew. Negative values mean puts dominate, pointing to bearish or defensive positioning.
Q6: What do reverse skew and forward skew indicate?
Answer: Reverse skew, where puts carry higher IV than calls, is the default in crypto bear markets and signals fear of sharp drawdowns. Forward skew shows up in bull runs when traders pay up for upside exposure, a pattern that appeared visibly around the April 2024 Bitcoin halving.
Q7: What is the difference between horizontal and vertical skew?
Answer: Vertical skew describes IV differences across strike prices at the same expiry. Horizontal or calendar skew covers IV differences across expiry dates at the same strike. Traders on Delta Exchange can observe both types in the options chain, with short-dated contracts often showing elevated IV around specific risk events.