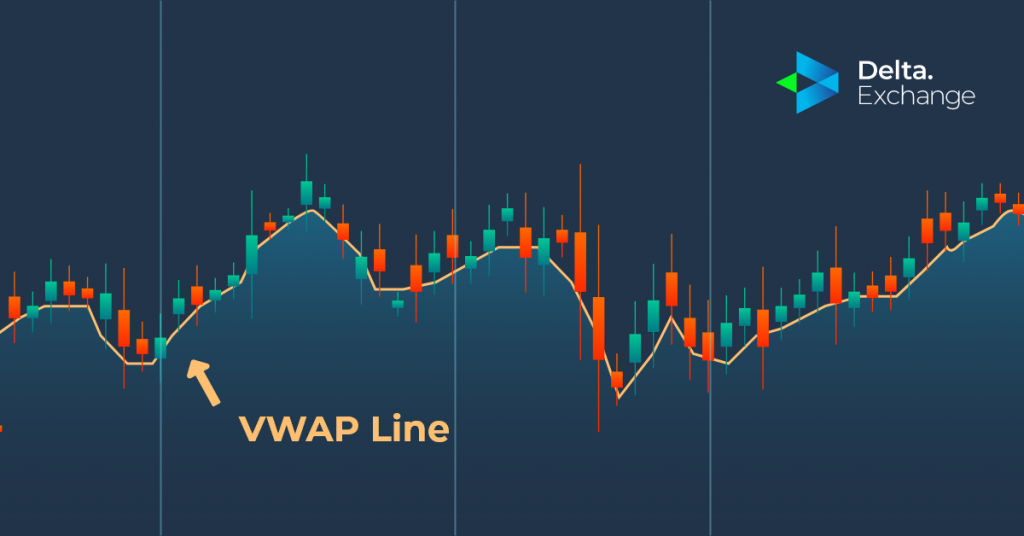
How To Use VWAP Indicator To Trade Crypto

What is the VWAP Indicator?
The VWAP indicator (Volume Weighted Average Price Indicator) is one of the most widely used technical analysis tools for intraday trading. It helps traders determine whether an asset is trading above or below its average price based on both price and trading volume. Because the VWAP indicator resets at the beginning of every trading session, it is especially useful for day traders looking to identify potential entry and exit points.
Crypto markets are relatively volatile and are prone to wild price swings. Since the crypto market operates 24/7, indicators like the VWAP indicator, or Volume Weighted Average Price Indicator, prove beneficial for identifying potential entry and exit points in shorter time frames. Therefore, the VWAP indicator is primarily used by day traders as part of a VWAP intraday strategy for timing their entries and exits.
Crypto traders build their trading strategies using the VWAP line to determine potential buying and selling opportunities. The Volume Weighted Average Price Indicator compares price with trading volume, helping traders understand whether the current market price is relatively expensive or inexpensive compared to the session's average traded price. This makes the VWAP indicator a valuable tool for identifying overbought and oversold conditions during intraday trading.
How Does a VWAP Indicator Work?
The VWAP indicator calculates the average price of an asset throughout a trading session while giving greater weight to price levels with higher trading volume. This enables traders to compare the current market price with the session's average traded price, making it easier to identify trend direction and potential trading opportunities.
When the VWAP indicator is interpreted correctly, traders are able to find better entries into the market. VWAP displays the relative value of current price action compared to previous trades executed during the session. As such, traders can exit their positions when they see that the price action of a particular cryptocurrency has moved significantly in a short period, or vice versa.
To understand how the Volume Weighted Average Price Indicator works, it is important to first understand how the VWAP value is calculated.
First, the VWAP line resets at the beginning of each trading day. This helps keep the daily VWAP values distinct and makes the indicator particularly useful for intraday and day trading strategies. The chart below clearly depicts a sharp slope in the blue VWAP line as trading starts the next day. This is due to the VWAP calculation being reset.

Source: TradingView
VWAP Formula
VWAP connects the typical prices of each candle over a selected time frame. A typical price is the average of the high, low, and closing prices for a particular candle.
Typical Price Formula
Typical Price = (High + Low + Close) / 3
While most chart patterns consider only the closing price of a candle, the VWAP indicator uses all three price levels - high, low, and close-to calculate a more balanced average price.
For instance, in the chart above, VWAP considers the average price of each 30-minute candle. This allows traders to better understand the relationship between price movement and trading volume, making the VWAP indicator an effective trend-following tool.
How Is the VWAP Value Calculated?
Once the typical price has been calculated, it is multiplied by the trading volume during that time frame to arrive at the current time frame subtotal.
Current Time Frame Subtotal = Typical Price × Volume (TP × V)
Once you calculate the subtotal for a particular timeframe, such as 30 minutes, the subtotal is added to the previous subtotal for the trading day, creating a cumulative TP × V value.
The final step is calculating the ratio of the cumulative TP × V value to the cumulative trading volume.
VWAP = Cumulative (TP × V) ÷ Cumulative Volume
These individual VWAP values are then joined together to form the VWAP line, which moves along with the cryptocurrency price throughout the trading session.
Modern trading platforms like Delta Exchange automatically perform these calculations, allowing traders to focus on interpreting the indicator rather than manually calculating it.
How to Use the VWAP Indicator to Spot Upcoming Market Trends?
The VWAP indicator is primarily designed for intraday trading because it resets at the start of every trading session. Traders use it to determine whether the market is trading above or below its average price while confirming the overall trend direction.
Since VWAP is most effective for day trading strategies, traders who hold their crypto positions for less than one trading day can benefit from using it.
For the best VWAP settings for day trading, traders commonly use shorter time frames such as:
- 1-minute chart
- 3-minute chart
- 5-minute chart
- 15-minute chart
These shorter time frames allow traders to analyze how the average price responds to changing trading volume throughout the session.
Although the VWAP indicator is widely used in stocks and cryptocurrencies, it is generally less effective in Forex markets because Forex is an over-the-counter (OTC) market where centralized trading volume is unavailable. In contrast, stock and cryptocurrency exchanges provide reliable volume data, making the Volume Weighted Average Price Indicator significantly more useful.
How to use the VWAP indicator to Spot Overbought & Underbought (Oversold) Levels?
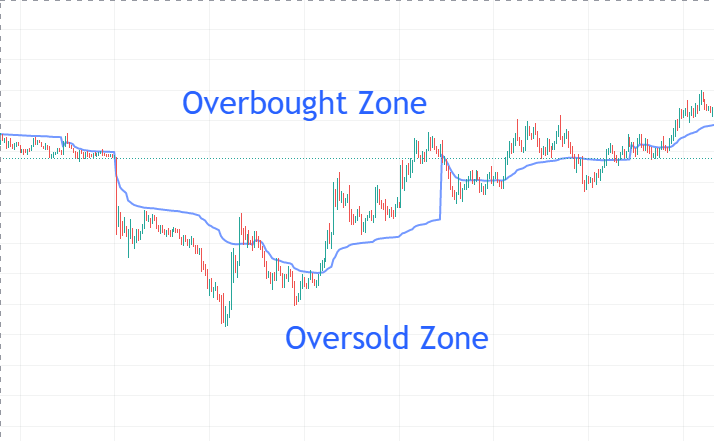
One of the most popular uses of the VWAP indicator is identifying whether an asset is trading above or below its average price for the day.
VWAP is used to determine the average price based on trading volume during a specific trading session. As discussed earlier, VWAP values represent the average weighted price at a particular point in time.
Since the VWAP line represents the session's average traded price:
- A price above the VWAP line generally indicates that the asset is trading at a premium to its average price and may be considered relatively overbought.
- A price below the VWAP line suggests that the asset is trading below its average price and may be considered relatively oversold or undervalued.
Considering the VWAP line as the average traded price, buying far above the VWAP line may result in paying a relatively higher price for the asset.
Similarly, when prices trade below the VWAP line, traders may view it as a potential buying opportunity. However, prices can continue moving lower, so traders should always combine the VWAP indicator with additional technical analysis tools and proper risk management before making trading decisions.
How to Trade using VWAP Indicator?
The VWAP indicator is most effective when used as part of a broader intraday trading strategy rather than as a standalone indicator. Traders often combine it with price action, support and resistance levels, trendlines, and other technical indicators to improve decision-making and reduce false signals.
While crypto markets function 24/7, trading volumes are generally lower during weekends. As the VWAP indicator is a day trading tool, it is calculated every day, including weekends. However, traders should exercise caution during periods of low trading volume, as even a single large trade can significantly influence price movement and affect VWAP readings.
For this reason, the VWAP indicator is generally considered more reliable during periods of higher market participation, which typically occur on weekdays.
Let's explore one of the most commonly used VWAP intraday strategies.
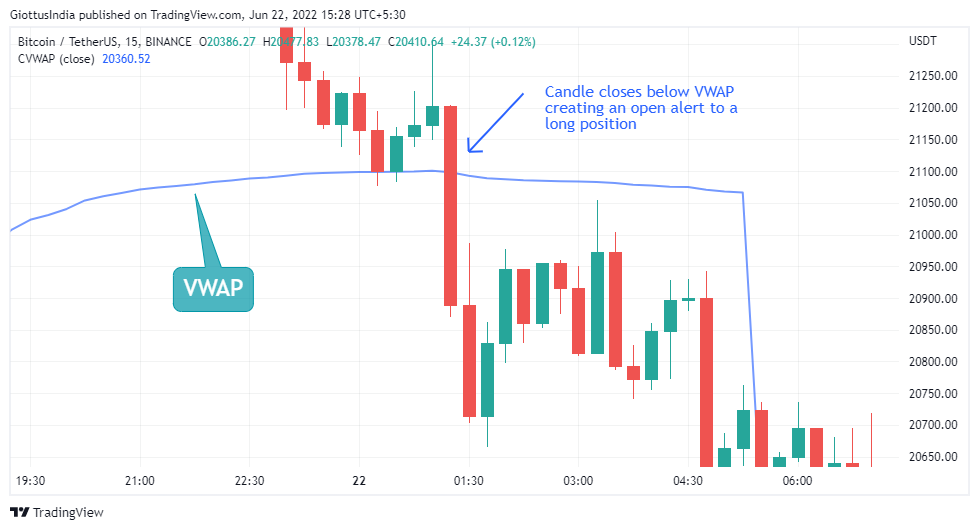
Once the candle closes above the VWAP, traders can enter a long position. The stop loss can be set just below the recent swing low. This way, even if there’s a price correction, it will happen back through the VWAP.
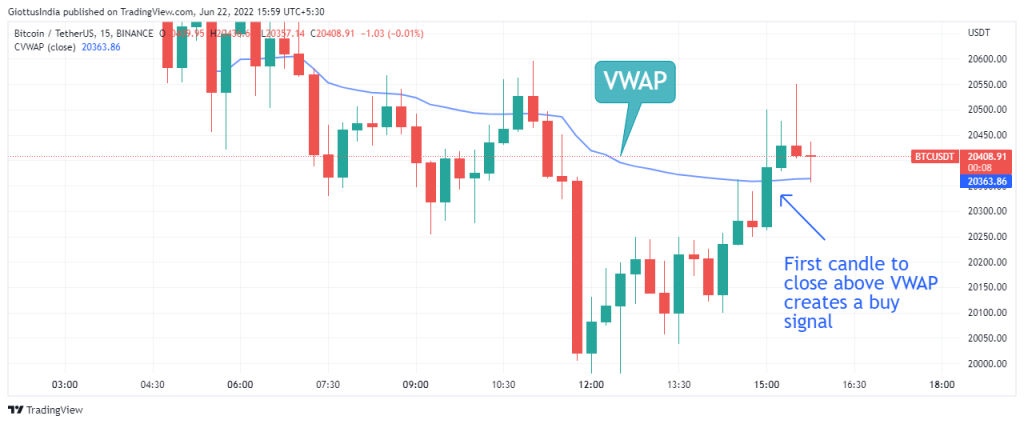
VWAP Intraday Strategy: The Retracement Trade
The VWAP retracement strategy is one of the most popular approaches used by day traders. It helps traders identify potential buying opportunities when the price temporarily moves below the VWAP before resuming the prevailing trend.
Below is a 15-minute BTC chart with the VWAP indicator represented by the blue line.
Before entering a trade, confirm that the overall market is in an uptrend. Once the trend is confirmed, look for long trading opportunities.
To open a long position:
- Wait for the price to retrace and close below the VWAP line.
- This temporary move below VWAP serves as an early indication that a potential buying opportunity may develop.
- Wait for the next candle to close back above the VWAP line.
- Once the candle closes above VWAP, traders may consider entering a long position.
- Place the stop loss below the most recent swing low to help manage downside risk.
This approach allows traders to enter after the market reclaims the VWAP line, indicating that buying momentum may be returning.
Like any technical trading strategy, the VWAP retracement strategy should be confirmed with additional indicators, price action, and sound risk management before placing a trade.
Difference between VWAP & moving VWAP
The VWAP calculator is reset every day to benefit the day traders. But there are times when the traders are interested in seeing the overall weighted pricing trend. Moving VWAP, or MVWAP, is what comes to the rescue in situations like these. A moving VWAP can be said to be a moving average of VWAP. A moving average captures the average change in data series over time. There are a few notable differences between the two:
- VWAP indicates oversold and overbought conditions in a market at a particular point of time, based on the trading volume. MVWAP is used as a moving average crossover strategy.
- VWAP is suitable for shorter-term day trading, while MVWAP is used in longer time chart frames, which may be days, weeks, or months.
- VWAP is a running total that captures the weighted price value throughout the day and is reset to start the next day afresh. However, Moving VWAP is an average value of your VWAP based on a selected range. MVWAP calculation continues throughout and is carried over each day, every day.
Is the VWAP Indicator Reliable?
The VWAP indicator is considered a reliable technical analysis tool for intraday trading when it is used alongside other indicators and proper risk management techniques. However, like any indicator, it is not free from limitations and can occasionally generate false signals.
No doubt, day trading is a risky venture in crypto trading. The VWAP indicator helps traders maintain greater consistency by providing a volume-based average price throughout the trading session.
However, VWAP may create false signals when the market experiences unusually high volatility or irregular trading activity.
Volume plays a major role in calculating the Volume Weighted Average Price Indicator.
During trading sessions with low trading volume, markets often remain range-bound. Under such conditions, VWAP signals may become less reliable because limited trading activity can distort the average price.
Therefore, while the VWAP indicator is useful for determining whether prices are relatively cheap or expensive during a trading session, relying on it as a standalone indicator may lead to inaccurate trading decisions.
For better results, traders commonly combine VWAP with:
- Pivot Points
- Support and Resistance Levels
- Trendlines
- Moving Averages
- Volume Indicators
- Candlestick Analysis
Using multiple technical analysis tools helps confirm trading signals and reduces the likelihood of acting on false market movements.
Conclusion
VWAP is a great tool for offsetting indecisiveness and random trades. It provides the average weighted price, which the day traders can use to their advantage and day trade their way to multiple profits. Using other technical analysis tools like channel bands, pivot pints, and trendlines with VWAP, many new trading strategies can be developed. Traders should be careful, use the VWAP indicator judiciously, and avoid false signals.
Watch Video for More Information: VMAP Strategies
FAQs
Q1: Which is the best candle time frame for VWAP?
Ans: Any short-term time frame of 1-, 2-, 3-, or 15-minute is suitable for VWAP.
Q2: VWAP is suitable for what kind of trading?
Ans: VWAP is suitable for day trading, in conjunction with other indicators, as the VWAP indicator resets itself at the start of a new day.
Q3: What does a VWAP indicator determine?
Ans: A VWAP indicator determines the average weighted price at a particular trading volume.
Q4: How should a trader trade the VWAP indicator?
Ans: Any price movement or closing of a candle below the VWAP indicates an approaching buy signal. As soon as any candle closes above the VWAP line, the traders should enter a long position and place a buy order.
Q5: Where should the stop loss be set?
Ans: A stop loss level should be set below the recent price swing when using the VWAP indicator for trading.