How to Trade With Trend Lines?

In the financial markets, traders use a variety of tools when performing technical analysis, (TA). These tools are necessary to help them to read and understand the previous chart movements before making analysis-based predictions of the next market movement. One of the most important tools that you’ll ever use in technical analysis is trend lines.
What are Trend lines?
Trend lines are diagonal lines that are drawn on charts in the financial markets trading. Trend lines are used to highlight, visualize, and make price action easier to analyze on different instruments and assets in the financial market. They are drawn across certain positions on the chart and serve three major functions; to show the market direction, to present clearer price action, and to predict future price movement. Trend lines are widely considered as useful tools in TA and are used by both price action traders and indicator-based traders, although the degree to which they are used by different traders may differ.
Features of Trend Lines
Trend lines are distinct due to their visual position, but they also possess a few other features that make it easier to identify and use them.
- Diagonal position: Trend lines are diagonal and are always inclined at an angle facing upward or downward. Because of this, they have slopes.
- Slopes: The slopes of trend lines can vary in steepness depending on the angle at which the trend lines are drawn. Generally, steeper slopes indicate stronger trends while gentler slopes indicate weaker trends.
- Dynamic support and resistance: Trend lines are natural dynamic lines for the support and resistance zones. Trend lines change according to the market movement and will always reflect the changing support and resistance prices.
How to Draw And Use Trend Lines?
To draw a trend line, you must choose a time frame that is higher than the 1 hour timeframe. This is because you want to find the price action for a longer period and not just some light movement.
Trend lines are drawn to touch at least three candlestick tips. The candle tips are either consecutively higher or consecutively lower. The trend line is meant to connect the tips in a sloping line to show the direction of the trend, and to show the highest and lowest points.
In the picture below, you can see how the trend line touches three consecutively lower points on the BTCUSD 4hr chart.

The trend line shows a strong downtrend because the slope is steep. The downtrend is visible and easier to analyze with the aid of the trend line.
In the next image, you see an uptrend clearly outlined by a trend line on a 4hr chart.
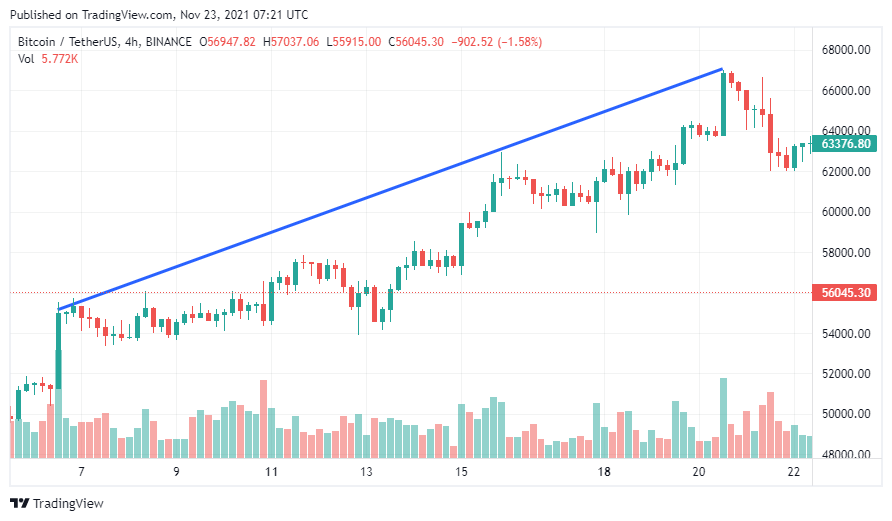
The chart shows dynamic support and resistance lines with respect to the downtrend and uptrend respectively. A trader that wants to trade trend lines must therefore incorporate the concept of support and resistance into their trades.
The Basics of Support and Resistance
Support and resistance lines are lines drawn on the price mark around which an asset’s price repeatedly “bounces” off. The support is a lower price on a downtrend at which price tends to reverse and move back up while the resistance is a higher price on an uptrend at which price tends to reverse and move down.
The concept of support and resistance helps traders to find better entry and exit spots on the market.
When trading with trend lines, the concept is applied in order to maximise the chances of winning trades.
For example, if you are trading the 4hr BTCUSD chart that shows a clear uptrend, you can find good entry and exit spots according to the chart below:
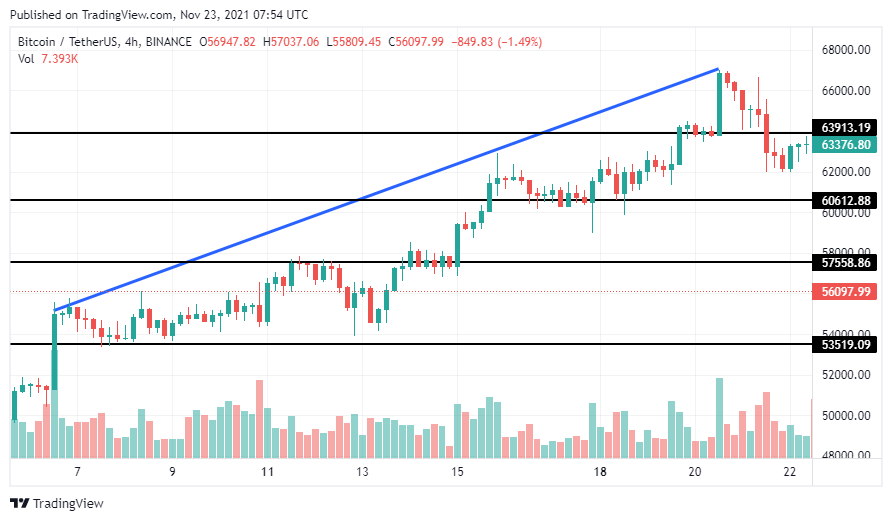
The black lines show good entry spots. Each entry is away from the blue trend line but eventually moves up close to it or touches it. If you enter one of the spots, you can set your take profit close to the blue trend line.
This can also be applied to the downtrend chart as follows:
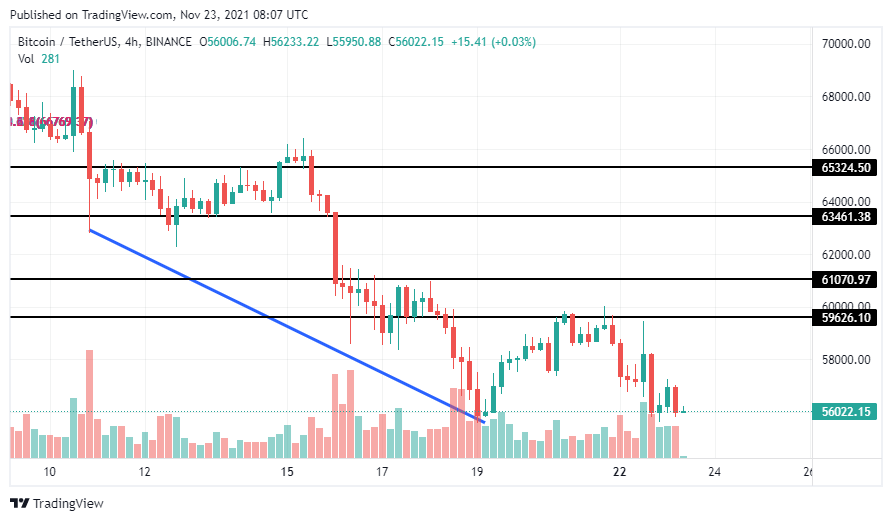
Again, the black lines show entry spots at which you can place trades whale targeting a few pips before hitting the lower trend line. The trend line serves as a dynamic support line that shows where price is most likely to reverse.
Your stop loss can be placed at a little distance above your entry point since the downturn shows a strong movement with slight retracements.
It is important to note that price can break structure and move above or below the up or down trend lines. This is why many traders combine indicators with trend lines or use their knowledge of candlestick patterns to trade. Now, trend lines are great for trading but care must be taken to reduce losses by combining other tools.
Advantages of Trading With Trend Lines
Trend lines are not only beneficial to price action traders, but they are also beneficial to indicator-based traders. In TA, trend lines offer the following benefits:
- A more precise analysis: Since trend lines are drawn across specific points, traders can perform analysis with more accuracy. Trend lines make it easier to spot important prices and make price-based decisions.
- Risk and profit management: Because they are useful as dynamic support and resistance lines, trend lines can be used by traders to determine the best way to manage their risks and profits. Traders can determine the best point to enter and exit a trade using trend lines. They can also predict the regions around which their Take Profit and Stop Loss will be set.
- Trend lines help traders to identify the direction and intensity of a market at one glance without stress. With trend lines, traders can quickly tell where a potential reversal, retracement, or breakout might occur.
- Trend lines can also be used to measure the supply and demand condition of any asset on the financial market.
Conclusion
Trading trend lines gives a higher chance of earning some profit with a few pips. The best thing about trend lines is that traders can easily trade with them for multiple price movements before the structure is broken.
Frequently Asked Question (FAQ)
Q1. What are trend lines and how are they used in technical analysis?
Answer: Trend lines are straight lines on a price chart connecting successive highs in a downtrend or successive lows in an uptrend. They help traders identify price direction and act as dynamic support or resistance levels for timing entries and exits.
Q2. What are the key features of trend lines in trading?
Answer: Valid trend lines need at least two confirmed touch points, should not cut through candle bodies, and gain strength with each additional touch. Steeper lines signal strong momentum while flatter lines suggest the trend is slowing down or consolidating.
Q3. How do you draw a trend line correctly on a chart?
Answer: For an uptrend, connect at least two successive higher lows. For a downtrend, connect two successive lower highs. Use wicks for precision, avoid intersecting candle bodies, and extend the line forward to mark future support or resistance zones.
Q4. What is the role of support and resistance when trading with trend lines?
Answer: An ascending trend line acts as dynamic support, with price bouncing upward from it. A descending trend line acts as resistance where price struggles to close above. A clean break through either signals a potential reversal or sharp acceleration.
Q5. How can traders find entry and exit points using trend lines?
Answer: Common entries are at a retest of the trend line after a confirmed bounce. Exits sit just below the line for longs. A clean break and retest of that level as new support or resistance confirms the signal.
Q6. What are the key advantages of trading with trend lines?
Answer: Trend lines are visual, simple, and work across all timeframes without lagging indicators. They give clear invalidation levels for straightforward risk management. On Delta Exchange, trend line analysis maps naturally onto leveraged futures setups where defined risk levels are critical.
Q7. Can trend lines be combined with other trading tools or indicators?
Answer: Trend lines work well with RSI divergence at touch points, volume confirmation on breaks, and moving averages running as parallel dynamic levels. Delta Exchange's Strategy Builder and Algo Marketplace let traders codify and deploy these multi-indicator setups without manual execution.