Ichimoku Cloud: A Complete Guide to Reading & Trading the Ichimoku Kinko Hyo Indicator

The Ichimoku Cloud (Ichimoku Kinko Hyo) is a Japanese technical indicator that plots five lines: Tenkan-sen, Kijun-sen, Senkou Span A and B, and Chikou Span, on one chart to show trend direction, momentum, and support/resistance at a glance, helping traders read bullish or bearish bias and time entries and exits.
Key takeaways:
- Combines five lines into one indicator: Tenkan-sen (9), Kijun-sen (26), Senkou Span A & B (the cloud, projected 26 periods forward), and Chikou Span (26 periods back).
- The cloud (Kumo) acts as dynamic support/resistance: price above it suggests an uptrend, below it a downtrend, inside it a flat/neutral range.
- Core ichimoku cloud strategies: Kumo breakout, Tenkan/Kijun cross, Kumo twist, and Chikou Span confirmation.
- Crypto traders often adjust the default 9/26/52 settings to 10/30/60 (or tighter, like 20/60/120) to reflect 24/7 markets.
- Works best in trending markets; signals inside the cloud or on very short (1–5 min) timeframes are less reliable.
The cryptocurrency market, similar to all financial markets, can fluctuate and get unpredictable at times, which is why crypto traders use a range of services and tools to formulate their trading strategies. TA or technical analysis is one of the most popular methods traders use to gauge the condition of the market. To conduct technical analysis, cryptocurrency traders use technical indicators - tools that analyze a crypto’s price, trading volume, and interest rates, among other things. Technical indicators can be used to forecast a crypto’s value at a specific point of time in the future and figure out the most profitable of trading opportunities.
The Ichimoku Cloud is a Japanese technical indicator that plots five lines on a price chart to reveal trend direction, momentum, and support/resistance levels at a glance. Traders use the Ichimoku indicator to identify bullish or bearish bias, forecast future support and resistance zones, and generate buy/sell signals through line crossovers.
The Ichimoku Kinko Hyo Cloud, or simply the Ichimoku Cloud, is one of the most prominent technical indicators in use in the crypto markets. In this post, we give you everything you need to know about the Ichimoku Cloud, including the core ichimoku cloud strategies traders use and how to read Ichimoku signals for crypto trading.
What Is the Ichimoku Cloud?
The Ichimoku Cloud, or Ichimoku Kinko Hyo, is a Japanese technical indicator that combines five separate moving-average-based lines into a single chart to provide insight into potential support and resistance price levels, market momentum, market trend direction, and more. Traders mostly use Ichimoku charts as a forecasting tool.
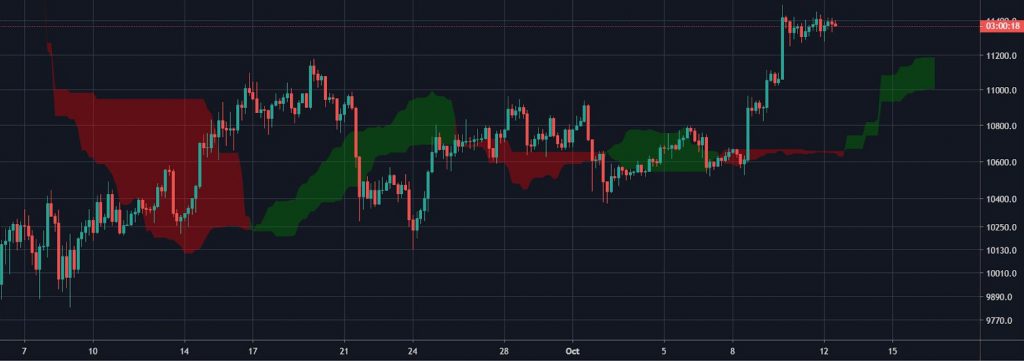
An Ichimoku Cloud Chart
The Ichimoku Cloud was developed in the late 1930s by a Japanese journalist named Goichi Hosoda. However, the Ichimoku trading strategy wasn't published until 1969. Hosoda named the tool Ichimoku Kinkō Hyō, which translates to "equilibrium chart at a glance" in Japanese. The Ichimoku Cloud is a moving-average-based trading indicator. A moving average, or MA, is a technical indicator that highlights crypto price trends over a specified period by smoothing out random, short-term price fluctuations. Because it layers multiple moving averages together, the Ichimoku Cloud produces far more data points than a standard candlestick chart alone. Even though the Ichimoku chart might seem complicated at first glance, this technical indicator is capable of producing clearly defined trading signals once you understand its components.
How Does the Ichimoku Cloud Work?
The Ichimoku Cloud plots five lines built from moving averages of past highs and lows: the Conversion Line (9-period), Base Line (26-period), Leading Span A and B (which form the cloud, projected 26 periods forward), and the Lagging Span (plotted 26 periods back). Together they combine leading and lagging signals into one chart.
Now let’s see how this particular method of technical analysis operates in crypto trading. The Ichimoku charts display information on the basis of both leading and lagging technical indicators. The usual Ichimoku chart consists of five lines, which are -
- The Conversion Line or the Tenkan-sen, with a 9-period moving average.
- The Base Line or the Kijun-sen, with a 26-period moving average.
- The Leading Span A or the Senkou Span A, with the moving average of the Conversion and Base Lines projected 26 periods in the future.
- The Leading Span B or the Senkou Span B, with a 52-period moving average projected 26 periods in the future.
- The Lagging Span or the Chikou Span, with the closing price of the current period projected 26 periods in the past.
Quick Overview of Ichimoku Cloud Components
Hosoda used the numbers 9, 26, and 52 in the Ichimoku Cloud settings since they seem to produce the best results; back in Hosoda’s time, the Japanese business schedule included Saturdays, therefore the number 9 stands for a week and a half, or 6 + 3 days. As for 26 and 52, those numbers symbolize respectively one and two months. While many people using the Ichimoku Cloud charts in today’s time avail Hosoda’s preferred setting, crypto markets trade 24/7 rather than on a traditional 5- or 6-day week, so many crypto traders adjust the Ichimoku Cloud settings to fit round-the-clock trading - shifting from 9, 26, 52 to 10, 30, 60. To filter out false signals, some traders adjust the settings further, to 20, 60, 120.
Because crypto markets trade 24/7 rather than on a traditional 5- or 6-day week, many crypto traders adjust the Ichimoku Cloud indicator settings to reflect round-the-clock trading - shifting from 9, 26, 52 to 10, 30, 60. To filter out false signals, some traders adjust the settings further, to 20, 60, 120.
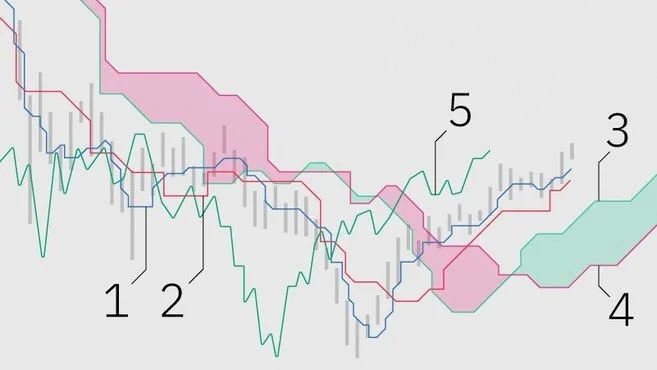
In the image above, we can see the Leading Span A at number 3 and the Leading Span B at number 4. The space between these two lines are responsible for producing the Kumo or the actual Ichimoku Cloud - the big green and red zones in an Ichimoku chart. The two aforementioned lines are projected 26 periods in the future to come up with forecasting insights and they are considered leading technical indicators. On the flip side, The Chikou Span (which can be seen at number 5 in the image above) is a lagging technical indicator which is projected 26 periods in the past. The Ichimoku clouds are always shown in either green or red, since they make reading the Ichimoku charts easier. The Leading Span A is the green cloud line, and the Leading Span B is the red cloud line. When the Leading Span A is higher up than the Leading Span B on an Ichimoku Cloud chart, a green cloud is generated, and similarly, a red cloud forms when the opposite happens. The Ichimoku Cloud varies from other technical analysis tools in the fact that the moving averages used by the Ichimoku charts are not calculated based off of the closing prices of the candles. Instead, the moving averages are computed based on the average of the high and low points documented within the specified period of time.
How Do You Calculate the Ichimoku Cloud Lines?
The Conversion Line and Base Line average each period's highest high and lowest low. Leading Span A averages the Conversion and Base Lines; Leading Span B uses a 52-period high/low average. Both leading spans are plotted 26 periods ahead, while the Lagging Span plots the current close 26 periods behind.
Below, you’ll find the standard equations for the first four lines that make up the Ichimoku Cloud trading indicator:
- The Conversion Line: (9 PH + 9 PL) / 2
- The Base Line: (26 PH + 26 PL) / 2
- The Leading Span A: (The Conversion Line + The Base Line) / 2
- The Leading Span B: (52 PH + 52 PL) / 2
Where PH stands for period high (the highest price seen during the given time period), and PL stands for period low (the lowest price seen within the specified time period). As for the Lagging Span, the closing price of the current period is plotted 26 periods in the past. Adding the Ichimoku Cloud technical indicator to your chart does the calculations for you.
What Can You Learn from the Ichimoku Cloud Charts?
1. Ichimoku Trading Signals:
Since there are multiple elements on the Ichimoku Cloud charts, the technical indicator produces different kinds of signals. They can be primarily divided into momentum and trend-following trading signals. Momentum signals are produced based on the relationship between the market price, the Base Line, and the Conversion Line. When either or both of the Conversion Line and the market price are above the Base Line, bullish momentum signals are received. On the contrary, bearish momentum signals are generated when either or both of the Conversion Line and the market price are below the Base Line. As for the trend-following signals, they are produced based on the color of the Ichimoku cloud, and the position of the market price in relation to said cloud. When the price of a specific crypto stays above the clouds, it can be assumed that there’s a high chance that the crypto is in an upward trend. However, if the price of the crypto is moving below the clouds, you may assume that the market is facing down. Further, if the market price for a crypto is moving sideways while staying inside the clouds, the market trend is usually considered flat or neutral. The Lagging Span is another element that can help crypto traders in figuring out potential trend reversals. The line gives information regarding the strength of the price action, suggesting a bullish trend when it moves above the market prices, and a bearish trend when it does the opposite. However, generally the Lagging Span is used jointly with the other elements of the Ichimoku charts, and not only on its own.
2. Support and Resistance Levels:
The Ichimoku Cloud charts can be used to find out the support and resistance zones. How? Well, usually, the Leading Span A serves as a support line during upward market trends, and as a resistance line during the down facing market trends. In either of these scenarios, the candlesticks move closer to the Leading Span A or the green cloud line. In case the market price moves into the cloud, the Leading Span B may also similarly serve as a support and resistance line. Since both the Leading Span lines are plotted 26 periods in the future, the Ichimoku Cloud charts allow traders to forecast potential support and resistance zones.
3. Crossovers:
Crossovers are another way to trade this indicator. If the Conversion Line moves above the Base Line while the market price is above the cloud, it's typically read as a strong buy signal - sometimes called a Golden Cross. The opposite setup, where the Conversion Line crosses below the Base Line while price is beneath the cloud, is known as a Dead Cross and is read as a strong sell signal. Crossovers that occur inside the cloud itself are generally considered weaker and less reliable than those confirmed above or below it.
What Are the Best Ichimoku Cloud Trading Strategies?
The most widely used ichimoku cloud strategies are the Kumo breakout, the Tenkan/Kijun cross, the Kumo twist, and Chikou Span confirmation — each reads a different combination of the indicator's five lines to time entries and exits.
- Kumo Breakout Strategy: A long bias forms when price closes above the Kumo (cloud); a short bias forms when it closes below. Because the cloud itself acts as a support/resistance band, many traders wait for a confirmed close beyond the cloud - rather than an intraday wick through it - before treating the breakout as valid.
- Tenkan-sen / Kijun-sen Cross Strategy: This is the crossover signal covered above: a bullish setup when the Conversion Line crosses above the Base Line, a bearish setup on the reverse cross. As noted earlier, the signal carries more weight when it occurs above or below the cloud rather than inside it.
- Kumo Twist Strategy: A "twist" happens when Senkou Span A crosses Senkou Span B, flipping the cloud's color further along the chart. A cross from below to above (cloud turns green) can flag a potential bullish reversal; a cross from above to below (cloud turns red) can flag a potential bearish reversal. Because the spans are plotted 26 periods forward, a twist can signal a possible shift in trend before price actually reaches that zone.
- Chikou Span Confirmation Strategy: Traders use the Chikou Span as a filter rather than a standalone trigger: a bullish bias is reinforced when the Chikou Span sits above the price plotted 26 periods earlier, and a bearish bias is reinforced when it sits below. This is typically combined with a Kumo breakout or a Tenkan/Kijun cross rather than traded on its own.
As with any technical strategy, these setups identify probability-weighted opportunities rather than guaranteed outcomes, and are typically combined with stop-losses and position sizing as part of a broader risk management plan.
Comparing the Ichimoku Cloud with Other Technical Indicators
A common question among traders is how the Ichimoku cloud indicator compares to other popular tools. The table below outlines the core differences.
Common Mistakes to Avoid When Trading the Ichimoku Cloud
Because the Ichimoku Cloud combines several signals into one chart, new traders sometimes misread it. Keep these points in mind:
- Relying on a single signal: treating one crossover or one cloud color as a standalone trade trigger, instead of confirming it with the other Ichimoku elements.
- Skipping risk management: no technical indicator, including the Ichimoku Cloud, removes the need for stop-losses and position sizing.
- Trading signals that form inside the cloud: these are typically weaker and more prone to false signals than those confirmed outside the cloud.
- Using default settings on 24/7 crypto markets: the 9/26/52 settings were built around a traditional stock-market week, so many crypto traders adjust them, as noted above.
- Ignoring cloud thickness: a thicker cloud generally represents a stronger support/resistance zone than a thin one.
- Using it for scalping on very short timeframes: Ichimoku's inputs are built around daily/weekly cycles, so it tends to be far more reliable on 4-hour, daily, and weekly charts than on 1-minute or 5-minute charts.
Conclusion
The Ichimoku Cloud remains one of the most comprehensive technical indicators available to crypto traders, combining trend, momentum, and support/resistance analysis into a single chart. Whether you use the default settings or adjust them for 24/7 crypto markets, understanding how to read Ichimoku cloud signals can sharpen your entries and exits. As with any Ichimoku trading strategy, combine it with sound risk management, and never rely on a single indicator alone.
If you'd like to learn more about crypto options trading, new DeFi projects to invest in, and the world of cryptocurrency in general, visit the Delta Exchange blog.
Disclaimer: This article is for educational purposes only and does not constitute financial or investment advice. The Ichimoku Cloud, like any technical indicator, does not guarantee profits or predict future prices with certainty. Please do your own research and consider your risk tolerance before trading.
Frequently Asked Questions (FAQs)
Q1. What is the Ichimoku Cloud and how is it used in crypto trading?
Answer: The Ichimoku Cloud is a Japanese multi-component indicator showing trend direction, momentum, and support/resistance in one view - letting crypto traders assess market bias without stacking multiple tools.
Q2. What are the five lines that make up an Ichimoku Cloud chart?
Answer: The five components are Tenkan-sen (9-period), Kijun-sen (26-period), Senkou Span A and B (plotted 26 periods ahead), and Chikou Span (closing price shifted 26 periods back for confirmation).
Q3. How does the Ichimoku Cloud generate momentum and trend-following trading signals?
Answer: Bullish signals fire when price trades above the cloud and Tenkan-sen crosses above Kijun-sen. Bearish signals trigger on the reverse. Chikou Span clearing prior price action confirms signal strength; signals inside the cloud are weak.
Q4. How can the Ichimoku Cloud be used to identify support and resistance levels?
Answer: The cloud acts as a dynamic support/resistance zone. Price approaching from above finds support at the upper edge; from below, resistance at the lower edge. Thicker clouds indicate stronger, harder-to-break levels.
Q5. What is the significance of the green and red clouds in an Ichimoku chart?
Answer: Green cloud (Span A above Span B) signals bullish bias; red signals bearish. Using cloud colour as a trend filter - longs in green, shorts in red - meaningfully reduces false signals in trending conditions.
Q6. How do crossovers work in Ichimoku Cloud analysis?
Answer: The Tenkan/Kijun crossover is the primary signal. A Golden Cross above the cloud is the strongest long setup; the same cross inside the cloud is weak. A Dead Cross below the cloud gives the highest-conviction short entry.
Q7. How can traders adjust Ichimoku Cloud settings for cryptocurrency markets?
Answer: Default settings (9, 26, 52) were designed for Japan's 6-day trading week. On Delta Exchange, where crypto trades 24/7, practitioners often shift to (10, 30, 60) or (7, 22, 44) to reduce lag and capture faster trend cycles.
Q8. What is the best Ichimoku cloud strategy for beginners?
Answer: The Kumo breakout is generally the most beginner-friendly Ichimoku cloud strategy: treat a confirmed close above the cloud as a long bias (or below it as a short bias), then look for a Tenkan/Kijun cross in the same direction before entering.
Q9. Can the Ichimoku Cloud be used alone, without other indicators?
Answer: Yes, it already combines trend, momentum, and support/resistance in one view - but many traders still pair it with a momentum oscillator like RSI or MACD to filter out false signals in choppy, sideways markets.