The Best Technical Indicators To Use For Crypto Options Trading

Technical indicators are instruments used by crypto traders to document and analyze past data about a crypto: namely its price history, trading volume, market sentiment and demand, supplies, and more. When forming a trading strategy, trading indicators can help with identifying the best opportunities in the future, for both short and long-term. Depending on your trading style, you can pick a technical indicator from the numerous options available out there. In this post, we discuss a few trading indicators most popular among crypto option traders. But first: a quick look at how crypto options trading is different from spot trading, and how that affects our choice of technical indicators.
How is Trading Crypto Options Different from Spot Trading?
As you’re likely aware, crypto options contracts are for those traders who wish to speculate on the future of a particular underlying crypto. The two kinds of crypto options contracts are:
- The call options: These give a trader the right to buy an underlying crypto at a fixed price on a predetermined expiry date.
- The put options: These give a trader the right to sell an underlying asset at a set price on the date of expiry.
It’s to be noted that while crypto options traders have the right to sell the underlying crypto on a fixed date and time in the future, they are under no obligation to do so. Now, why might you have to choose different technical indicators for crypto options trading from the ones used for spot trading? Well, when used to form short-term trading strategies, trading indicators help traders determine factors like:
- The range of the price movement the crypto is witnessing
- The direction of the movement
- The duration of the movement
However, with crypto options, there’s an additional, significant factor: the holding period. While a regular trader can keep a position open for an indefinite time, a crypto options trader is bound by the limited time until the option’s expiry date. That is why, to suit the time constraints, momentum indicators are quite popular among crypto options traders, to figure out the overbought and oversold levels. Now, let’s take a look at some technical indicators you can effectively use for crypto options trading.
Best Technical Indicators for Crypto Options Trading
RSI or the Relative Strength Index: RSI or the Relative Strength Index is a momentum indicator that flags overbought (70+) and oversold (30 or below) conditions - see our full guide to RSI in crypto trading for the formula and worked examples.

The Bollinger Bands: Crypto options traders are well aware of the importance of the price volatility factor; selling options during a highly volatile period when options prices are higher than usual translates into profit, as does buying options in a period of low volatility when the prices are much lower. The Bollinger Bands instrument is another momentum technical indicator fit to accurately measure volatility. Named after John Bollinger, this trading indicator consists of three bands on a chart, with the middle band representing the value of the given underlying crypto. The three bands expand as price volatility increases, and contract as volatility decreases. The closer the middle band moves to the upper band, the more overbought the crypto is. On the flip side, the closer the middle band is to the lower band, the more oversold the crypto is considered to be.
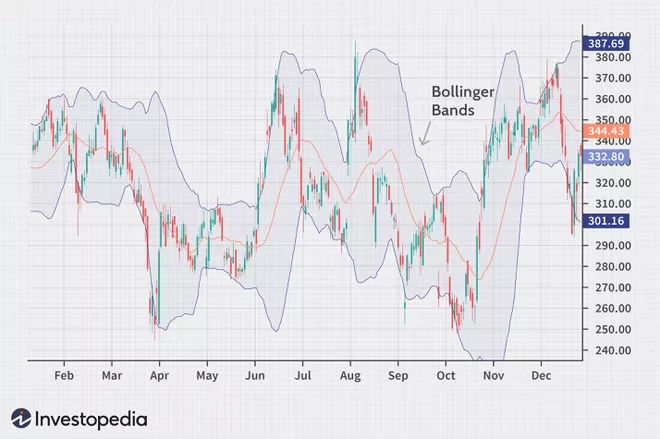
Keep in mind that a price movement outside of the upper or lower band may signify a reversal, so a crypto options trader can enter the market consequently. Like so: if the middle band breaks out above the top band, you could go for a long put or a short call strategy in the crypto options market. Similarly, the middle band breaking out below the lower band would signal an opportunity for a long call or a short put position.
Moving Averages: The moving averages make up a technical indicator quite simple to use, but pretty comprehensive when it comes to analyzing past price data for a crypto. The trading indicator is customizable, since you get to select the extent of time over which you would want to calculate the moving average. It goes without saying that the longer the given time period, the more precise the average. The most commonly used MAs are the 50-day and 200-day moving averages.
MACD, or the Moving Average Convergence Divergence: The MACD technical indicator is another oscillator, as in it appears on a chart as two oscillating lines not bracketed by any boundaries. MACD is good for determining past price trends, and overbought or oversold conditions. When it’s a bull market, the MACD indicator will cross and move above zero. Of course, the opposite symbolizes a bearish market.
How to Trade Crypto Options on Delta?
Now that you know some of the best technical indicators you can use for crypto options trading, your journey as an options trader may begin! Delta Exchange offers full options chains on BTC and ETH, and daily options are available on XRP, LTC, ETH, BNB, LINK, BCH, ADA and SOL. There are three types of crypto options Delta offers, which are:
- Vanilla Options: Call and put vanilla options are available for BTC, ETH, BNB, LINK, XRP, LTC, BCH, SOL and ADA.
- Move Options: If you wish to speculate on the volatility of an underlying crypto, this is the sort of contract you should pick.
- Turbo Options: For turbo options, a knockout barrier is attached to your regular vanilla call/ put options. While a vanilla option has a certain expiry date, a Turbo option may expire before the fixed expiry date in case the underlying crypto’s value reaches the knockout barrier.
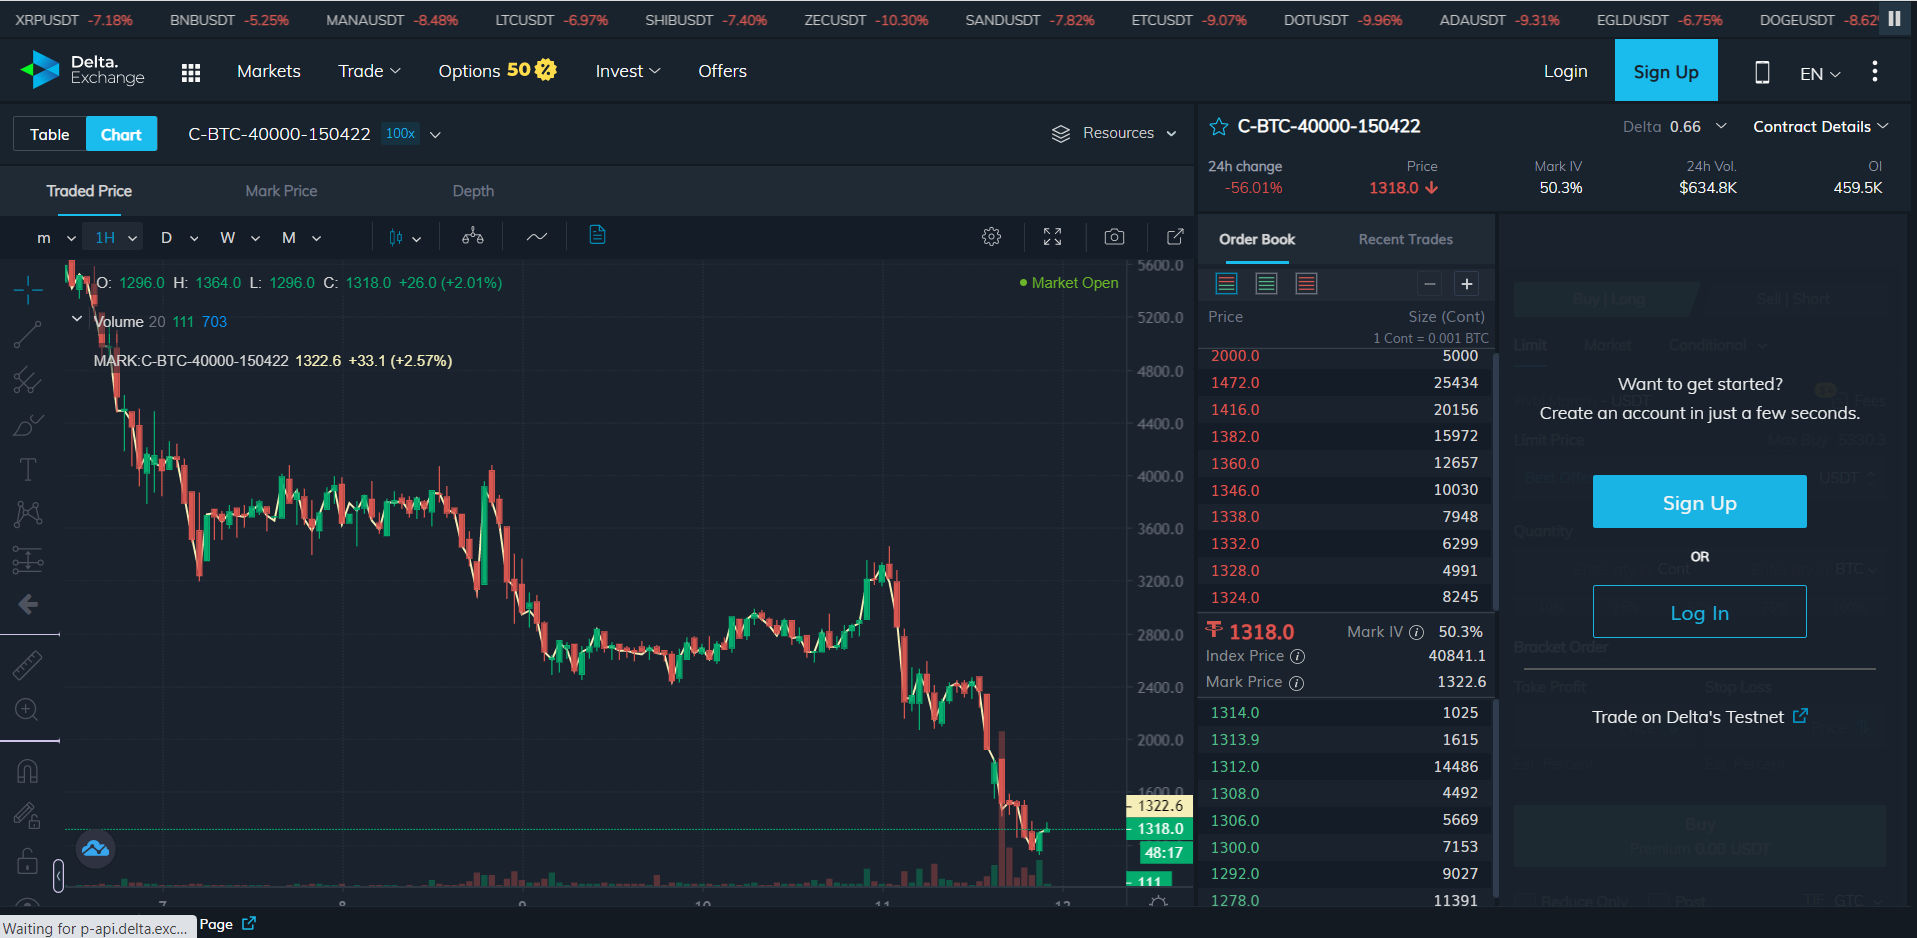
Head over to the options market on Delta to pick the crypto options you want to trade! Good luck with trading options on Delta Exchange!
FAQs
Q1: What are technical indicators in crypto trading?
Answer: They're math-based tools that analyse price, volume, and momentum to spot trends and reversals. Crypto options traders use them alongside implied volatility to time entries on calls, puts, and spreads more confidently.
Q2: What are the best technical indicators for crypto options trading?
Answer: RSI, Bollinger Bands, and MACD work well together. Paired with Delta Exchange's implied volatility surface, they help you decide whether buying or selling premium makes more sense given what the market's actually doing.
Q3: How do Bollinger Bands work in crypto options trading?
Answer: They plot bands around a moving average using standard deviations. A squeeze signals an incoming breakout - great for straddles or strangles. When bands widen, a trend is running, favouring straightforward directional plays like long calls or puts.
Q4: What is MACD in crypto trading and how is it used?
Answer: MACD tracks two moving averages converging or diverging. When the MACD line crosses above the signal line, momentum is turning bullish - a useful cue for call-buying. Price divergence often flags reversals worth hedging with protective puts.
Q5: Why are momentum indicators important in crypto options trading?
Answer: Because theta punishes hesitation. Weak momentum means time decay erodes your position fast. Combining RSI and MACD with options Greeks like delta and gamma helps you pick smarter strikes and expiries with better profit probability.